
How to use Signal Hound SM435C for testing millimeter-wave communication systems
Step-by-Step Guide: Testing Millimeter-Wave Communication Systems with the Signal Hound SM435C
I. Pre-Test Preparation: Hardware Setup & Configuration
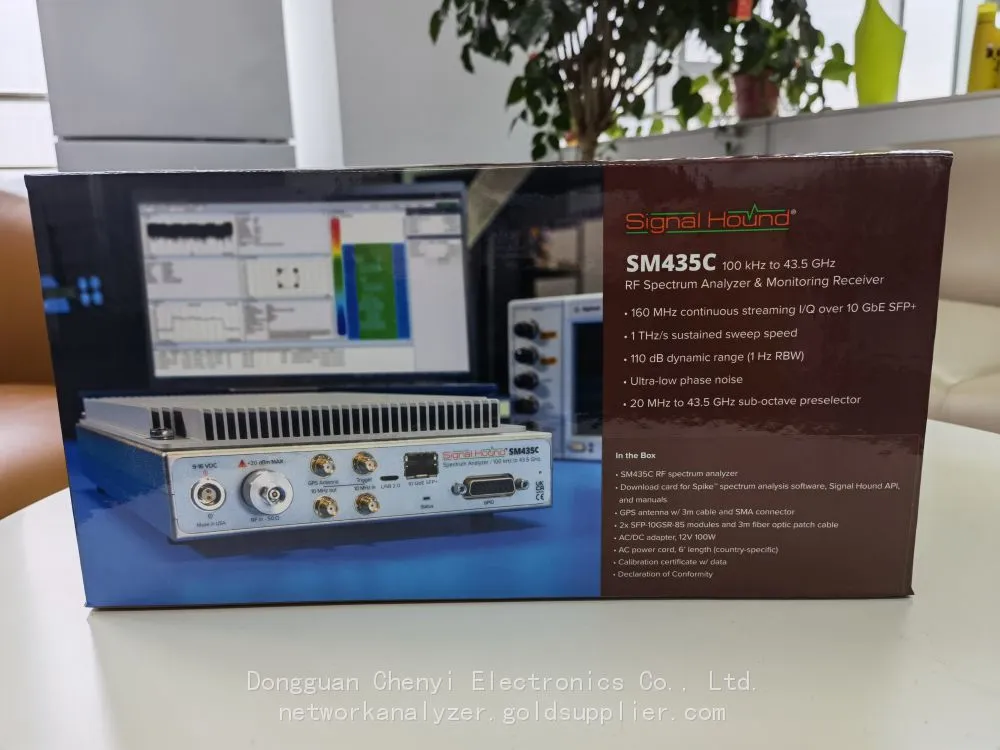
Before initiating tests, ensure the SM435C is optimized for millimeter-wave performance—critical for accurate measurements in 24GHz, 28GHz, and 39GHz bands.
1. Essential Hardware & Accessories
Component | Purpose | Recommendation |
SM435C Analyzer | Core signal capture & analysis | Enable Option1 wide-temperature mode for field testing (-40°C to 65°C) |
Low-Loss RF Cable | Minimize signal attenuation at high frequencies | RG-400 or equivalent (≤1dB loss at 40GHz per meter) |
Low-Noise Preamplifier | Boost weak millimeter-wave signals (compensates for cable/antenna loss) | Signal Hound PA-28G (15dB gain, 1.8dB noise figure at 28GHz) |
Millimeter-Wave Antenna | Transmit/receive signals (directional for beamforming; omnidirectional for link tests) | Cobham ARA-400 (24–40GHz, 8dBi gain) |
10GbE Network Card | Enable full 160MHz I/Q streaming (avoid USB 3.0 bottlenecks) | Intel X550-T1 (supports jumbo frames up to 9000 MTU) |
External OCXO Clock | Ensure phase coherence for multi-channel tests (e.g., beamforming) | Signal Hound OCXO-10 (±5×10⁻¹¹ stability) |
2. Initial SM435C Configuration (via Spike Software)
1. Connectivity Setup:
◦ Use Cat6a fiber optic cable to link SM435C’s SFP+ port to the 10GbE network card .
◦ Configure network settings: Enable jumbo frames (9000 MTU) and set IP address to match the analyzer’s subnet.
1. Frequency & Bandwidth Settings:
◦ Set center frequency to target band (e.g., 28GHz for 5G Millimeter wave).
◦ Select 160MHz Instantaneous Bandwidth (IBW) (note: 160MHz full bandwidth not guaranteed below 650MHz ).
1. Calibration:
◦ Run full self-calibration (Spike > Tools > Calibration) to ensure amplitude accuracy (±3.0dB above 6GHz ).
◦ For EVM/modulation tests, perform reference level calibration with a known signal source (e.g., Keysight E8267D).
II. Core Test Scenarios & Step-by-Step Workflows
The SM435C excels in four critical millimeter-wave communication tests: link budget validation, modulation quality (EVM), beamforming performance, and interference analysis.
1. Link Budget Validation (24–43.5GHz)
Purpose: Verify signal strength, path loss, and receiver sensitivity for point-to-point (P2P) or 5G base station-user equipment (UE) links.
Workflow:
1. Hardware Connection:
◦ Connect SM435C to the DUT (Device Under Test: e.g., 5G millimeter-wave UE) via low-loss cable + preamplifier.
◦ For over-the-air (OTA) tests, position the analyzer’s antenna 3–5 meters from the DUT (ensure line-of-sight unless testing NLOS performance).
1. Spike Software Configuration:
◦ Select Spectrum Analyzer Mode > Set RBW to 1MHz (balances resolution and scan speed ).
◦ Enable Max Hold to capture peak signal power; set reference level to -10dBm (accommodates typical millimeter-wave transmit power).
1. Key Measurements:
◦ Transmit Power: Record peak power (ensure compliance with 3GPP TS 38.101-4: ≤24dBm for 28GHz).
◦ Path Loss: Calculate as Transmit Power - Received Power - Antenna Gain - Preamplifier Gain.
◦ Receiver Sensitivity: Reduce DUT transmit power until received signal is 3dB above SM435C’s DANL (-156dBm/Hz at 28GHz ).
1. Example Result:
A 28GHz 5G UE with 20dBm transmit power, paired with 8dBi antennas (tx/rx) and 15dB preamplifier, should yield received power ≥-70dBm at 10-meter LOS—indicating a viable link.
2. Modulation Quality Testing (EVM for 64QAM/256QAM)
Purpose: Validate modulation accuracy (critical for 5G-Advanced 256QAM, where EVM ≤3.5% per 3GPP 38.101-4 ).
Workflow:
1. Hardware Setup:
◦ Connect SM435C directly to the DUT’s RF output (avoid OTA for precise EVM measurements).
◦ Sync the analyzer to the DUT’s clock via 10MHz reference input (reduces phase noise impact ).
1. Software Configuration:
◦ Switch to Modulation Analyzer Mode (Spike > Tools > Modulation Analysis).
◦ Select modulation type (e.g., 256QAM) > Set symbol rate to DUT’s bandwidth (e.g., 100MHz for 5G NR).
◦ Enable 10GbE I/Q Streaming (Spike > I/Q > Stream to Disk) to capture 2-second I/Q blocks for post-processing.
1. EVM Measurement:
◦ SM435C’s -138dBc/Hz phase noise (1GHz carrier) enables EVM .08% for 256QAM .
◦ Use Error Vector Magnitude tab to view:
▪ Average EVM (target: for 256QAM; 64QAM ).
▪ IQ constellation plots (identify gain imbalance or phase offset issues).
1. Troubleshooting:
◦ If EVM exceeds limits: Check cable connections (replace if VSWR >1.6 ) or adjust DUT’s power amplifier linearity.
3. Beamforming Performance Testing (Multi-Channel)
Purpose: Validate gain, directionality, and adaptive beam steering for phased-array antennas (e.g., 5G base stations).
Workflow:
1. Multi-Channel Setup:
◦ Deploy 2–4 SM435Cs (synced via 10MHz reference and PPS triggers ) around the DUT’s phased array.
◦ Each analyzer connects to a directional antenna aimed at the DUT (separated by ≥λ/2 to avoid phase ambiguity).
1. Configuration:
◦ On each SM435C: Set center frequency to 28GHz, IBW to 80MHz, and enable phase coherence (Spike > Sync > External Clock).
◦ Use Spike’s Multi-Unit Control to synchronize scans across analyzers.
1. Key Measurements:
◦ Beam Gain: Calculate as Received Power (peak beam) - Received Power (off-axis). Target: ≥25dBi for 64-element arrays.
◦ Beamwidth: Measure 3dB down points from peak (target: 10°–15° for 5G millimeter-wave).
◦ Adaptive Steering: Command DUT to steer beams to different angles (0°–90°); verify analyzers detect peak power at intended directions .
1. Data Analysis:
◦ Stream I/Q data via 10GbE to MATLAB; use beamforming algorithms (e.g., MUSIC) to map beam patterns.
◦ Example: A 39GHz base station with adaptive beamforming should maintain ≥20dBi gain across 60° coverage.
4. Interference Detection & Mitigation
Purpose: Identify in-band interference (e.g., adjacent 5G cells, industrial noise) that degrades link quality.
Workflow:
1. Setup:
◦ Configure SM435C for Real-Time Spectrum Mode (160MHz IBW, 30kHz RBW) .
◦ Enable waterfall plot (Spike > Display > Waterfall) with 1-second update rate to capture transient interference.
1. Interference Hunting:
◦ Use Frequency Mask Trigger (FMT) to alert when signals exceed -50dBm (typical interference threshold).
◦ For OTA tests: Move the analyzer’s directional antenna to triangulate interference sources (use TDOA if multiple SM435Cs are deployed).
1. Characterization:
◦ Measure interference bandwidth (use Spectrogram View) and power level.
◦ Example: A 28GHz link experiencing 10dB SNR degradation may trace to a nearby industrial radar (24–26GHz) with harmonic emissions.
1. Mitigation Validation:
◦ Re-test after adjusting DUT’s frequency (e.g., shift from 28.1GHz to 28.3GHz) or adding a bandpass filter.
III. Advanced Optimization & Troubleshooting
1. Maximize 10GbE Streaming Performance
• Use SSD with ≥500MB/s write speed for I/Q data logging (avoids dropped frames during 160MHz streaming ).
• Configure network card for TCP offloading (reduces CPU load for long-duration tests).
2. Improve Weak Signal Detection
• Add a low-noise preamplifier (e.g., PA-28G) to reduce system noise figure from 13dB to 5–7dB at 28GHz .
• Use Nuttall window (Spike > RBW > Window Type) for better dynamic range (115dB typical ).
3. Troubleshoot Common Issues
Issue | Root Cause | Solution |
High EVM (>5% for 256QAM) | Phase noise or cable loss | Sync to external OCXO; replace cables with low-loss alternatives |
Missing 160MHz IBW | Center frequency | Increase center frequency to ≥1GHz |
Slow scan speed | RBW too narrow or USB 3.0 used | Set RBW to 30kHz; switch to 10GbE (1THz/s scan speed ) |
Inconsistent multi-channel data | Poor synchronization | Check 10MHz/PPS connections; use external OCXO |
IV. Automation with SM435C API (Python Example)
For repetitive tests (e.g., production line validation), use the SM435C’s Python API to automate workflows. Below is a snippet for 28GHz EVM testing:
import signalhound import time # Connect to SM435C via 10GbE sa = signalhound.SM435C("192.168.1.100") # Replace with analyzer IP # Configure test parameters sa.set_frequency(28e9) # 28GHz center frequency sa.set_ibw(160e6) # 160MHz instantaneous bandwidth sa.set_reference_level(-10) # Reference level: -10dBm # Start I/Q streaming sa.start_iq_stream("C:/test_data/28ghz_evm.iq", duration=2) # 2-second capture time.sleep(3) # Calculate EVM (using Signal Hound's modulation analysis library) evm_result = sa.calculate_evm(modulation="256QAM") print(f"Average EVM: {evm_result['average']:.2f}%") # Pass/fail check (3GPP 256QAM limit: ≤3.5%) if evm_result['average'] : print("Test PASSED") else: print("Test FAILED") sa.disconnect() |
Conclusion
The SM435C’s combination of 160MHz real-time bandwidth, 10GbE connectivity, and phase coherence makes it a versatile tool for millimeter-wave communication testing. By following the workflows above—from link budget validation to beamforming analysis—engineers can ensure their 5G-Advanced, aerospace, or industrial systems meet performance and regulatory requirements.
For complex scenarios (e.g., multi-user MIMO testing), consider integrating the SM435C with a channel emulator (e.g., Keysight M8195A) to replicate real-world propagation conditions. Additionally, leveraging the analyzer’s rugged design enables field testing in harsh environments, ensuring lab results translate to real-world reliability.
Recently Posted
-
Cost-Benefit Analysis: Why Choose Signal Hound BB60D for RF Testing Projects
July 2, 2026Cost-Benefit Analysis: Why Choose Signal Hound BB60D for RF Testing ProjectsIn enterprise RF testing projects, laboratory scientif Read More
 -
Ultimate Buying Guide for Signal Hound BB60D Real-Time Spectrum Analyzer: Features, Uses & Benefits
July 2, 2026Ultimate Buying Guide for Signal Hound BB60D Real-Time Spectrum Analyzer: Features, Uses & BenefitsFor RF engineers, laborator Read More
 -
Common Application Scenarios & User Cases of Signal Hound BB60D Spectrum Analyzer
July 2, 2026Common Application Scenarios & User Cases of Signal Hound BB60D Spectrum AnalyzerThe Signal Hound BB60D real-time spectrum ana Read More
 -
Signal Hound BB60D for Radar Signal Analysis & Pulse Signal Testing
July 2, 2026Signal Hound BB60D for Radar Signal Analysis & Pulse Signal TestingRadar signal analysis and pulse signal testing are high-pre
Read More

Contact Us
Recommended Products
-
 Signal Hound SM200C 100 KHz to 20 GHz Real-time Spectrum Analyzer With 10GbE Monitoring ReceiversNegotiableMOQ: 1 Unit
 -
Signal Hound VSG200 Vector Signal Generator 100 KHz to 20 GHzNegotiableMOQ: 1 Unit
-
Signal Hound BB60C 9 KHz to 6 GHz Real-time Spectrum AnalyzerNegotiableMOQ: 1 Unit
-
Signal Hound BB60D 9 KHz to 6 GHz Real-time Spectrum AnalyzerNegotiableMOQ: 1 Unit
-
Signal Hound SP145 100 KHz to 14.5 GHz Real-time Spectrum Analyzer Monitoring ReceiversNegotiableMOQ: 1 Unit
-
Signal Hound VSG60A 50 MHz to 6 GHz GHz Vector Signal GeneratorNegotiableMOQ: 1 Unit
-
Signal Hound VSG25A 100 MHz to 2.5 GHz Vector Signal GeneratorNegotiableMOQ: 1 Unit
-
Signal Hound VNA400 40 MHz to 40 GHz 2-port Vector Network AnalyzerNegotiableMOQ: 1 Unit
-
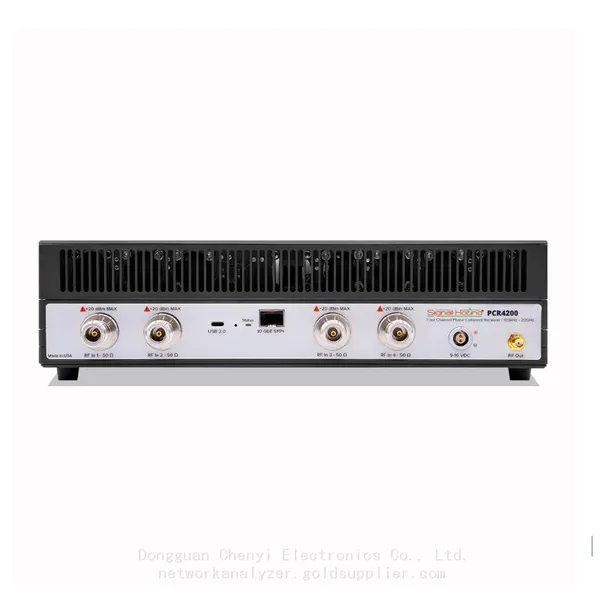
Signal Hound PCR4200 100 KHz to 20 GHz Four-Channel Phase Coherent ReceiverNegotiableMOQ: 1 Unit
-
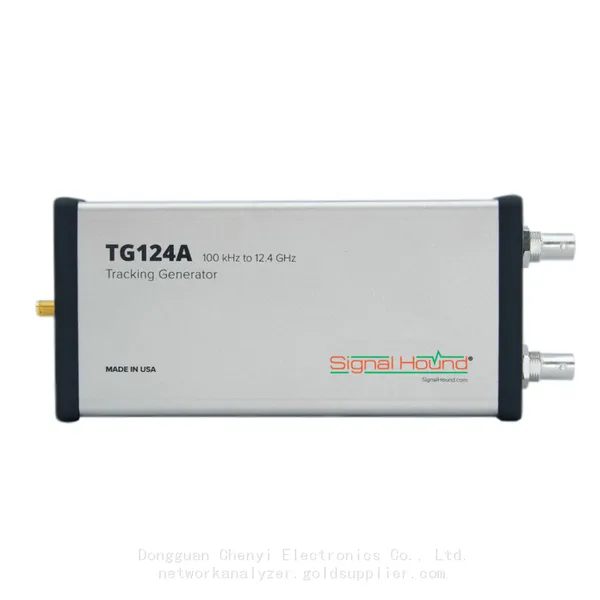
Signal Hound TG124A 100 KHz to 12.4 GHz Tracking GeneratorNegotiableMOQ: 1 Unit
-
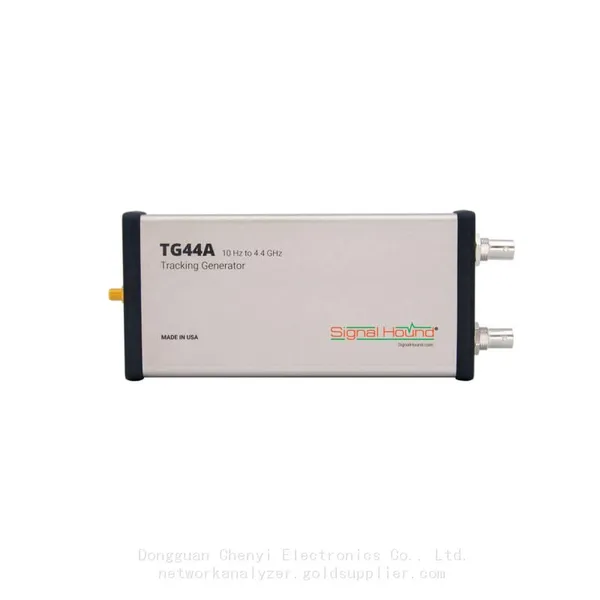
Signal Hound TG44A 10 Hz to 4.4 GHz t Tracking GeneratorNegotiableMOQ: 1 Unit
-
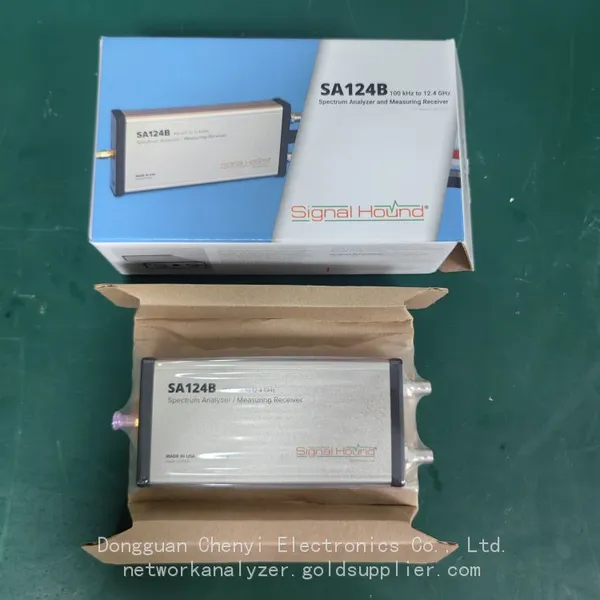
Signal Hound SA124B 100 KHz to 12.4 GHz Spectrum AnalyzerNegotiableMOQ: 1 Unit
-
Signal Hound SA44B 1 Hz to 4.4 GHz Spectrum AnalyzerNegotiableMOQ: 1 Unit
-
Signal Hound SM200B 100 KHz to 20 GHz Real-time Spectrum Analyzer Monitoring ReceiversNegotiableMOQ: 1 Unit
-
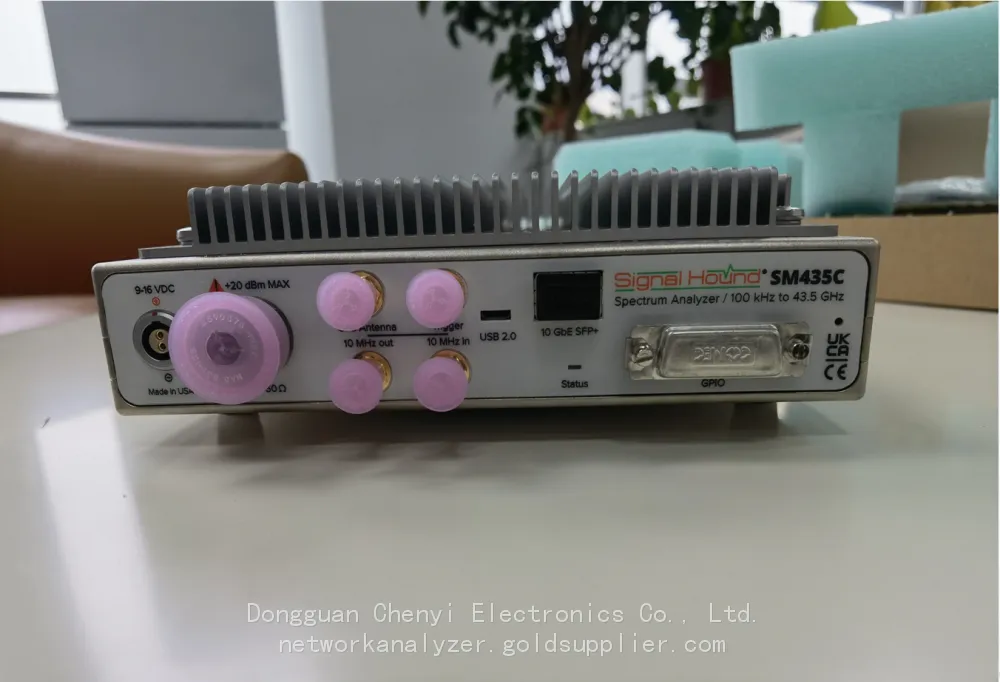
Signal Hound SM435C 100 KHz to 43.5GHz Real-time Spectrum Analyzer With 10GbE Monitoring ReceiversNegotiableMOQ: 1 Unit
-
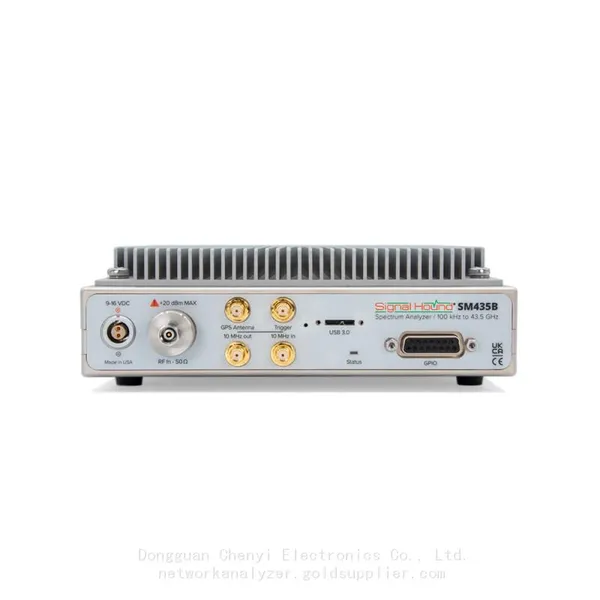
Signal Hound SM435B 100 KHz to 43.5GHz Real-time Spectrum Analyzer Monitoring ReceiversNegotiableMOQ: 1 Unit
-
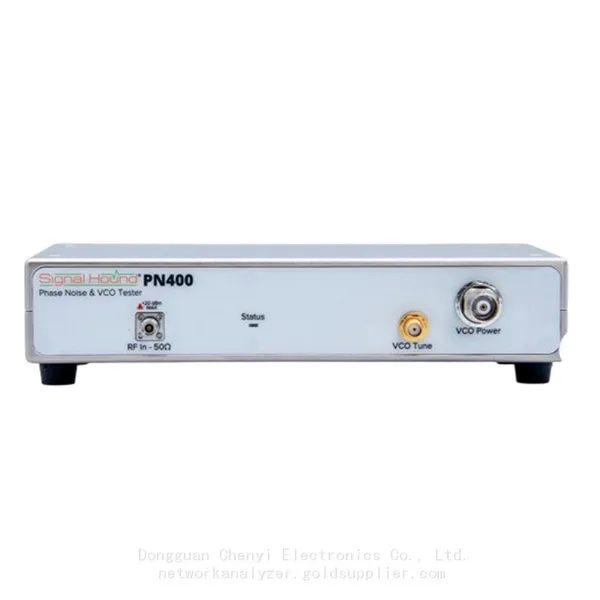
Signal Hound PN400 Phase Noise and VCO Test System 100 KHz to 43.5 GHzNegotiableMOQ: 1 Unit
-
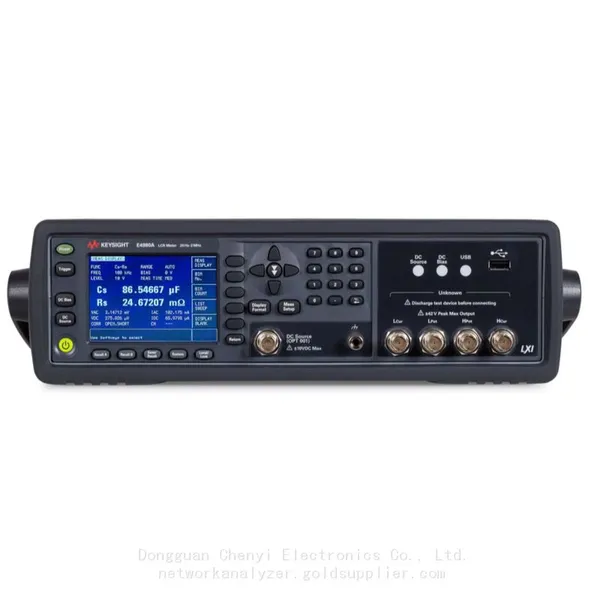
Keysight E4980A Precision LCR Meter 20 Hz to 2 MHzNegotiableMOQ: 1 Unit
-
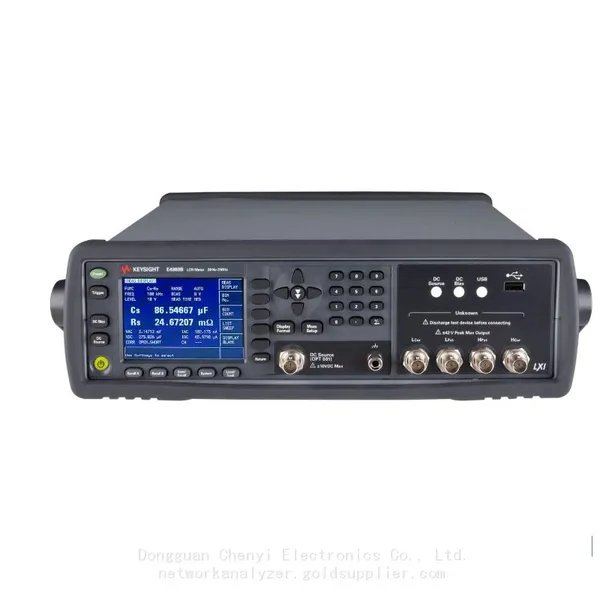
Keysight E4980B and E4980BL Precision LCR Meter 20 Hz to 2 MHzNegotiableMOQ: 1 Unit
-
Keysight U1733C Handheld LCR Meter 100Hz 120Hz 1kHz 10kHz 100kHzNegotiableMOQ: 1 Unit