
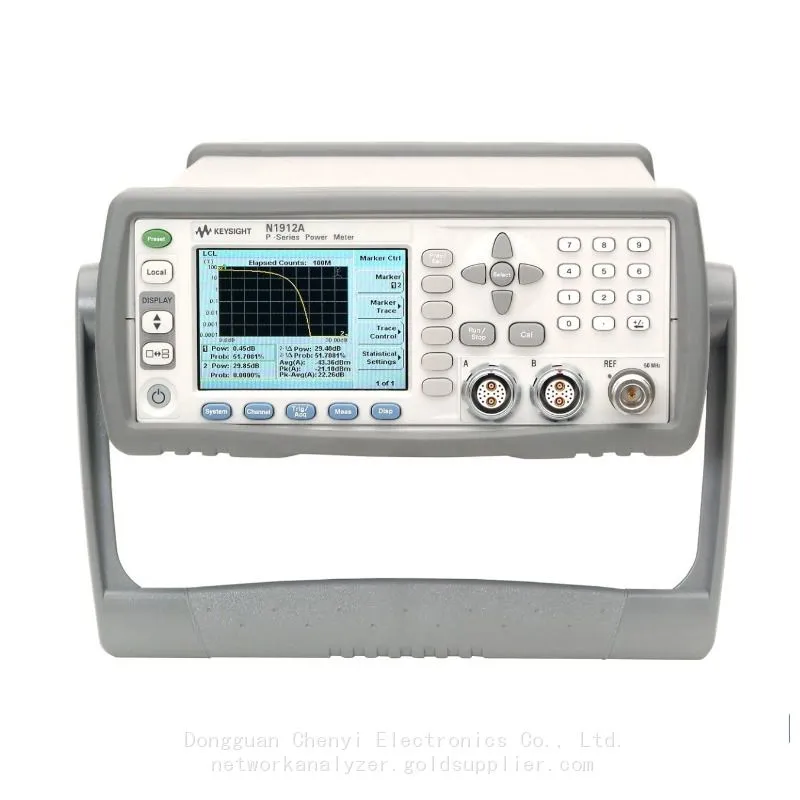
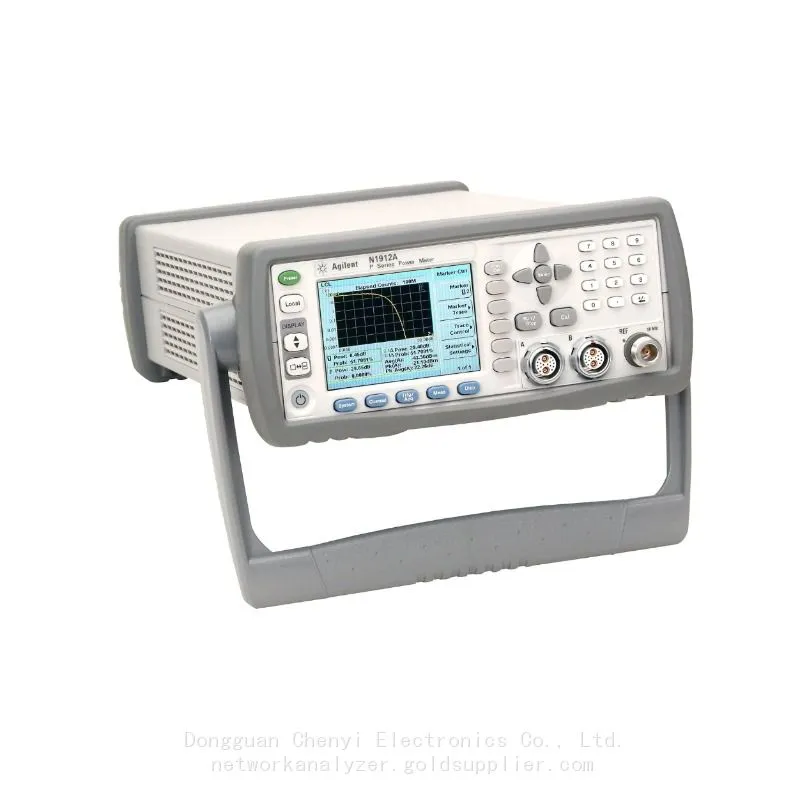
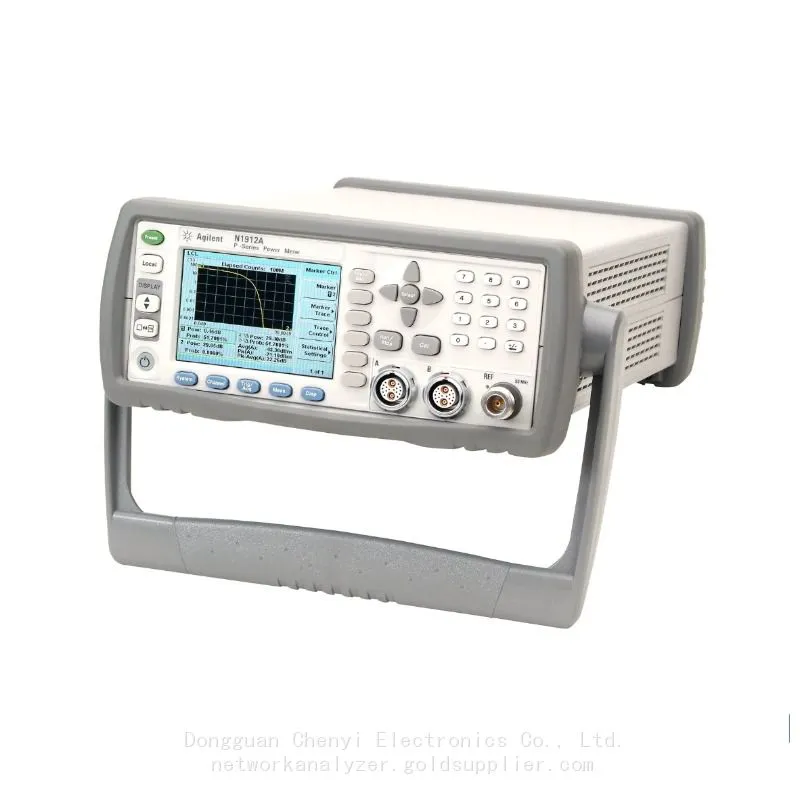
Keysight N1911A power meter, single chann and N1922A wideband power sensor, 50 MHz to 40 GHz
Keysight N1911A power meter, single chann and N1922A wideband power sensor, 50 MHz to 40 GHz
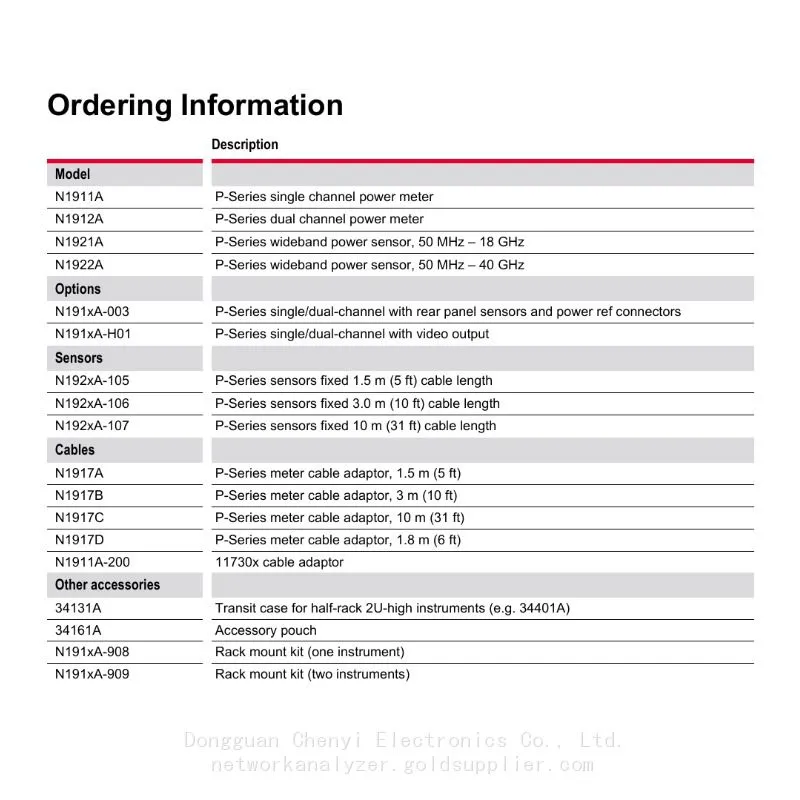
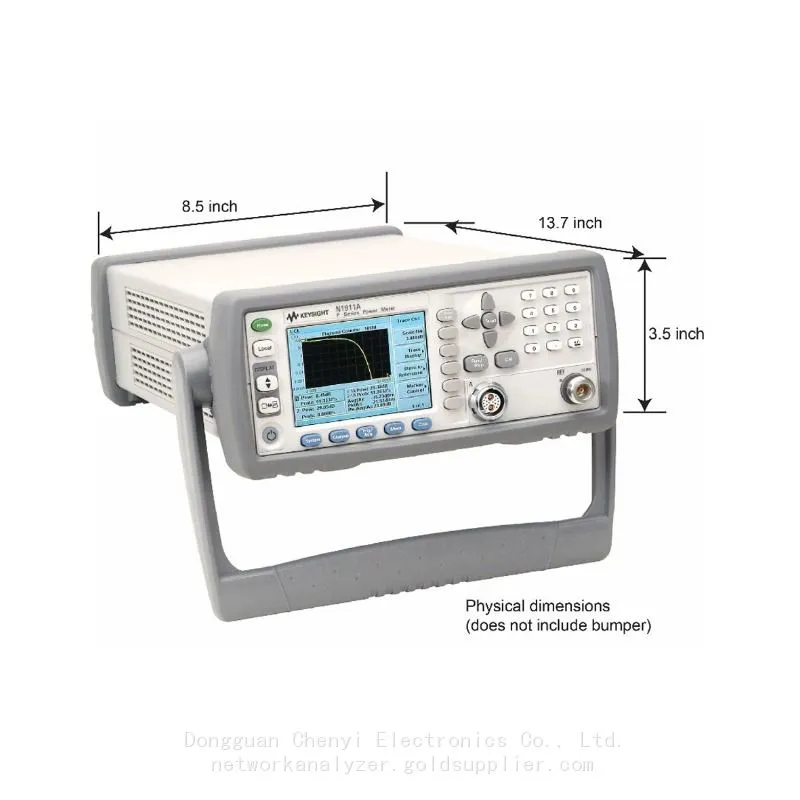
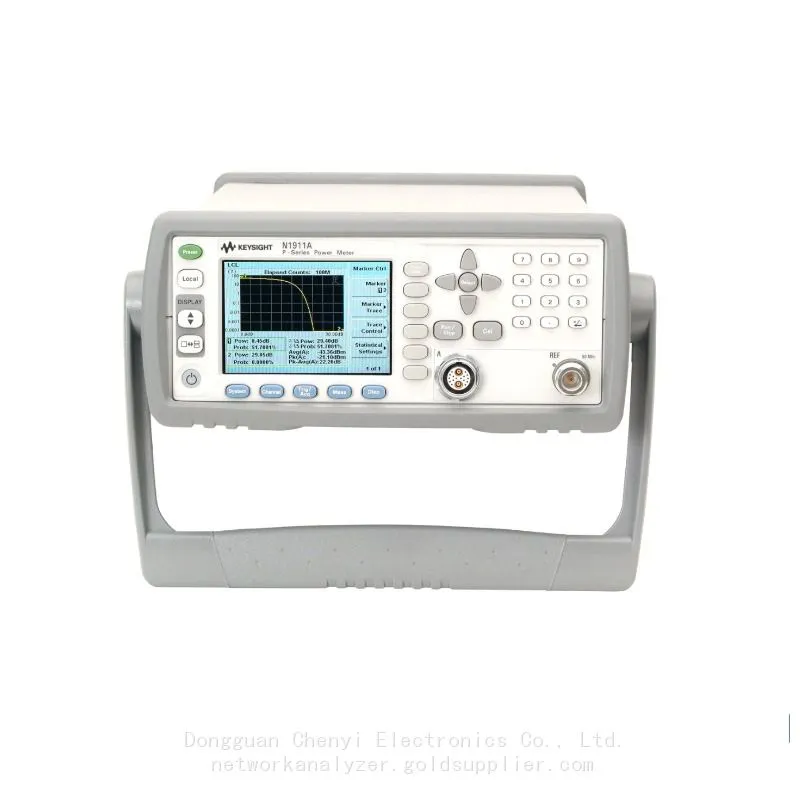
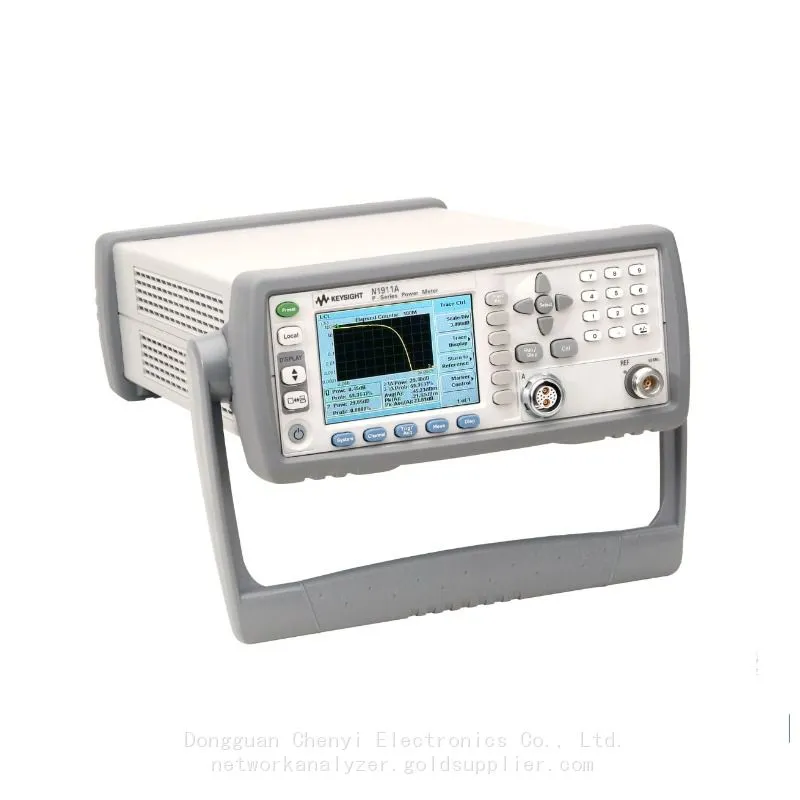
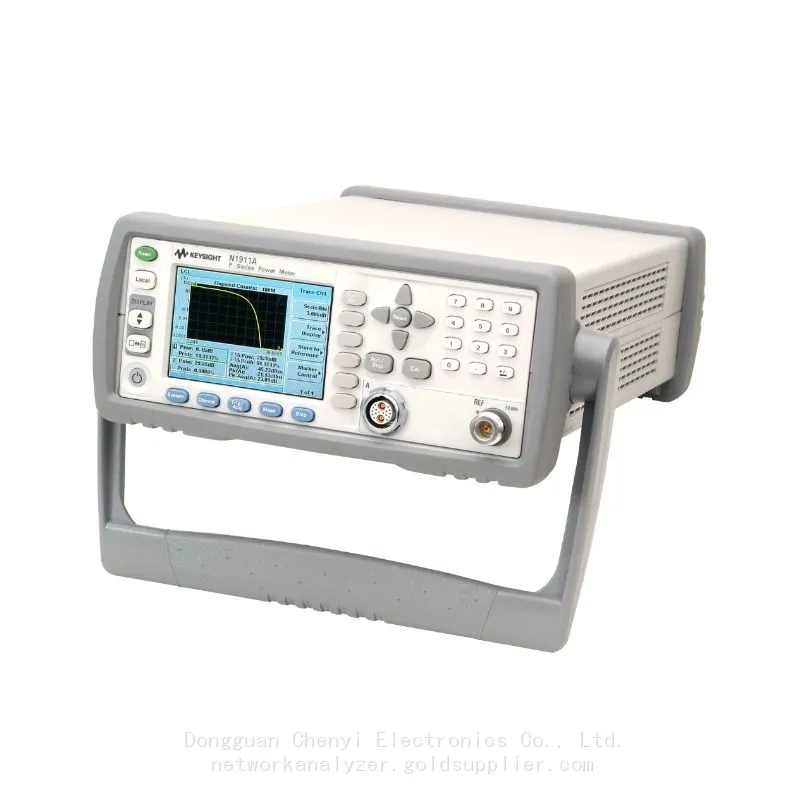
N1911A P-Series power meter, single channel
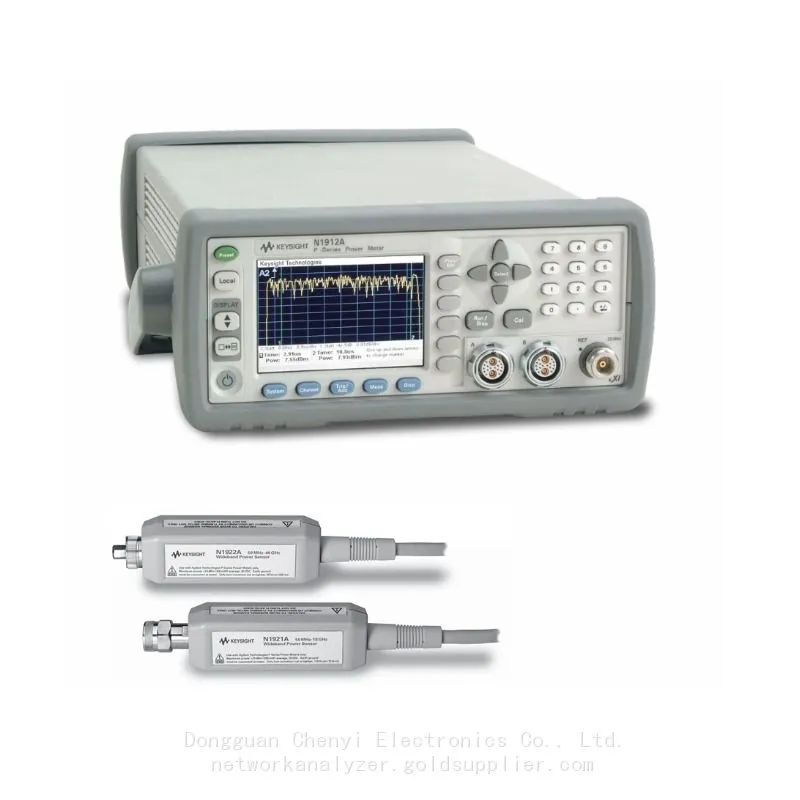
N1912A P-Series power meter, dual channel
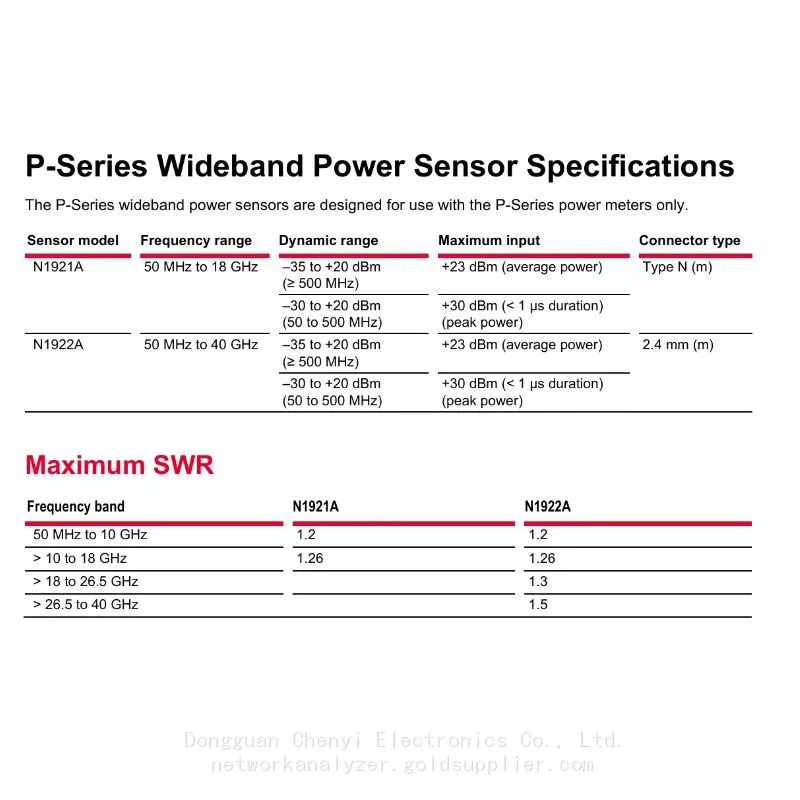
N1921A P-Series wideband power sensor, 50 MHz to 18 GHz
N1922A P-Series wideband power sensor, 50 MHz to 40 GHz
Highlights
▶30 MHz video bandwidth
▶Single-shot real-time capture at 100 Msamples/sec
▶Key Measurements: peak, average, peak-to-average ratio, rise time, fall time, and pulse width
▶22 Predefined formats: WiMAX, DME, HSDPA, etc.
▶One screen view for pulse measurement analysis: Auto Scale, Auto Gate, Rise/Fall Time, Duty Cycle, etc.
▶Internal Zeroing and Calibration while connecting to the DUT
▶Your instrument can be controlled at no additional cost using the BenchVue Basic Power
When used with the N192XA wideband power sensors, the N1911/12A P-Series power meter provides a
measurement frequency range from 50 MHz to 40 GHz with an internal zero and calibration capability.
▶LXI-C Compliance
▶Average triggering for average power measurement
▶Versatile connectivity with USB, LAN, and GPIB standard
▶High Speed Complementary Cumulative Distribution Function (CCDF) statistical analysis
▶Compatible with the industry standard N8480/8480 and E-series sensors, which provide a wide dynamic
range from -70 to +44 dBm, and a frequency coverage from 9 kHz to 110 GHz
▶Compatibility with E932x power sensors
▶Difference and ratio math functions : (A-B, B-A, A/B, and B/A)
▶2-year calibration cycle
LXI Class-C-Compliant Power Meters
A P-Series power meter is a LXI Class-C-compliant instrument, developed using LXI Technology. LXI, an acronym for
LAN eXtension for Instrumentation, is an instrument standard for devices that use the Ethernet (LAN) as their primary
communication interface.
Hence, it is an easy-to-use instrument especially with the usage of an integrated Web browser that provides a convenient
way to configure theinstrument’s functionality.
The P-Series power meters are supported by the Keysight BenchVue software and BV0007B Power Meter/Sensor Control
and Analysis app. BenchVue makes it easy to control your power meter to log data and visualize measurements in a wide
array of display options without any programming. BenchVue software license (BV0007B) is now included with your instrument.
Specification definitions
There is one type of product specifications:
- Warranted specifications are specifications which are covered by the product warranty and apply over 0 to 55 ºC unless
otherwise noted. Warranted specifications include measurement uncertainty calculated with a 95% confidence.
- Characteristic specifications are specifications that are not warranted. They describe product performance that is useful
in the application of the product.
Characteristic information is representative of the product. In many cases, it may also be supplemental to a warranted
specification. Characteristic specifications are not verified on all units. There are several types of characteristic specifications.
These types can be placed in two groups:
One group of characteristic types describes ‘attributes’ common to all products of a given model or option.
Examples of characteristics that describe ‘attributes’ are product weight, and 50 ohm input Type-N connector.
In these examples product weight is an ‘approximate’ value and a 50ohm input is ‘nominal’.
These two terms are most widely used when describing a product’s ‘attributes’.
The second group describes ‘statistically’ the aggregate performance of the population of products.
These characteristics describe the expected behavior of the population of products. They do not guarantee the
performance of any individual product. No measurement uncertainty value is accounted for in the specification.
These specifications are referred to as ‘typical’.
Conditions
The power meter and sensor will meet its specifications when:
Stored for a minimum of two hours at a stable temperature within the operating temperature range,
and turned on for at least 30 minutes
The power meter and sensor are within their recommended calibration period, and
Used in accordance to the information provided in the User's Guide.
Sensor Calibration Uncertainty
Definition: Uncertainty resulting from non-linearity in the sensor detection and correction process.
This can be considered as a combination of traditional linearity, cal factor and temperature specifications and
the uncertainty associated with the internal calibration process.
Mechanical Characteristic
Mechanical characteristics such as center conductor protrusion and pin depth are not performance specifications.
They are, however, important supplemental characteristics related to electrical performance. At no time should
the pin depth of the connector be protruding.
System Specifications and Characteristics
The video bandwidth in the meter can be set to High, Medium, Low and Off. The video bandwidths stated in the
table below are not the 3 dB bandwidths, as the video bandwidths are corrected for optimal flatness (except the Off filter).
Refer to Figure 2 for information on the flatness response. The Off video bandwidth setting provides the warranted rise
time and fall time specification and is the recommended setting for minimizing overshoot on pulse signals.
Recorder output and video output
The recorder output is used to output the corresponding voltage for the measurement a user sets on the Upper/Lower
window of the power meter.
The video output is the direct signal output detected by the sensor diode, with no correction applied. The video output
provides a DC voltage proportional to the measured input power through a BNC connector on the rear panel. The DC
voltage can be displayed on an oscilloscope for time measurement. This option replaces the recorder output on the rear
panel. The video output impedance is 50 ohm.
Characteristic Peak Flatness
The peak flatness is the flatness of a peak-to-average ratio measurement for various tone-separations for an equal magnitude
two-tone RF input. Figure 2 refers to the relative error in peak-to-average ratio measurements as the tone separation is varied.
The measurements were performed at –10 dBm with power sensors with 1.5 m cable lengths.
Effect of video bandwidth setting
The noise per sample is reduced by applying the meter video bandwidth filter setting (High, Medium or Low). If averaging is
implemented, this will significantly impact the effect of changing the video bandwidth.
Effect of time-gating on measurement noise
The measurement noise on a time-gated measurement will depend on the time gate length. 100 averages are carried out
every 1 μs of gate length. The Noise-per-Sample contribution in this mode can approximately be reduced by √(gate length/10 ns)
to a limit of 50 nW.
Recently Posted
-
Rohde Schwarz RTP044B
May 13, 2026Rohde & Schwarz RTP044B: Redefining High‑Performance OscilloscopyIn the fast‑paced world of high‑speed digital and RF design,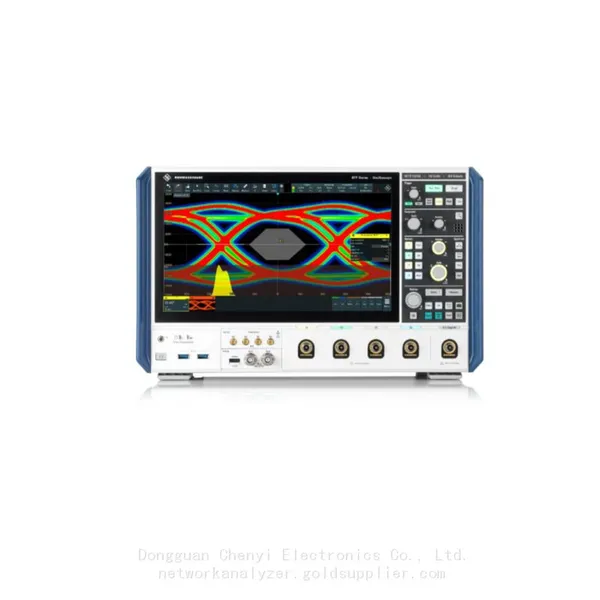 Read More
 -
Rohde Schwarz RTP044B
May 13, 2026Rohde & Schwarz RTP044B High‑Performance Oscilloscope – 4 GHz Bandwidth for Precision Signal TestingThe Rohde & Schwarz RT
Read More -
Rohde Schwarz RTP064B
May 13, 2026Rohde & Schwarz RTP064B High Performance Oscilloscope English Foreign Trade ArticleThe Rohde & Schwarz RTP064B is a profes Read More
 -
Rohde Schwarz RTP0134B
May 13, 2026Rohde & Schwarz RTP0134B High‑Performance Oscilloscope – 13 GHz Bandwidth for Advanced Signal IntegrityThe Rohde & Schwarz Read More

Contact Us
Recommended Products
-
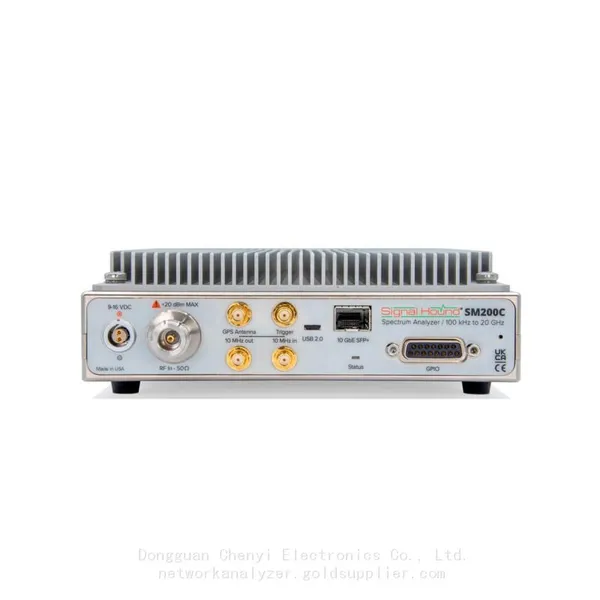
 Signal Hound SM200C 100 KHz to 20 GHz Real-time Spectrum Analyzer With 10GbE Monitoring ReceiversNegotiableMOQ: 1 Unit
 -
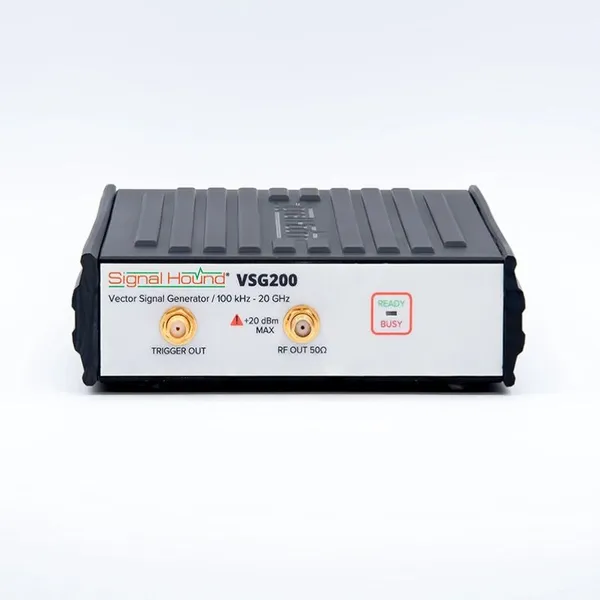
Signal Hound VSG200 Vector Signal Generator 100 KHz to 20 GHzNegotiableMOQ: 1 Unit
-
Signal Hound BB60C 9 KHz to 6 GHz Real-time Spectrum AnalyzerNegotiableMOQ: 1 Unit
-
Signal Hound BB60D 9 KHz to 6 GHz Real-time Spectrum AnalyzerNegotiableMOQ: 1 Unit
-
Signal Hound SP145 100 KHz to 14.5 GHz Real-time Spectrum Analyzer Monitoring ReceiversNegotiableMOQ: 1 Unit
-
Signal Hound VSG60A 50 MHz to 6 GHz GHz Vector Signal GeneratorNegotiableMOQ: 1 Unit
-
Signal Hound VSG25A 100 MHz to 2.5 GHz Vector Signal GeneratorNegotiableMOQ: 1 Unit
-
Signal Hound VNA400 40 MHz to 40 GHz 2-port Vector Network AnalyzerNegotiableMOQ: 1 Unit
-
Signal Hound PCR4200 100 KHz to 20 GHz Four-Channel Phase Coherent ReceiverNegotiableMOQ: 1 Unit
-
Signal Hound TG124A 100 KHz to 12.4 GHz Tracking GeneratorNegotiableMOQ: 1 Unit
-
Signal Hound TG44A 10 Hz to 4.4 GHz t Tracking GeneratorNegotiableMOQ: 1 Unit
-
Signal Hound SA124B 100 KHz to 12.4 GHz Spectrum AnalyzerNegotiableMOQ: 1 Unit
-
Signal Hound SA44B 1 Hz to 4.4 GHz Spectrum AnalyzerNegotiableMOQ: 1 Unit
-
Signal Hound SM200B 100 KHz to 20 GHz Real-time Spectrum Analyzer Monitoring ReceiversNegotiableMOQ: 1 Unit
-
Signal Hound SM435C 100 KHz to 43.5GHz Real-time Spectrum Analyzer With 10GbE Monitoring ReceiversNegotiableMOQ: 1 Unit
-
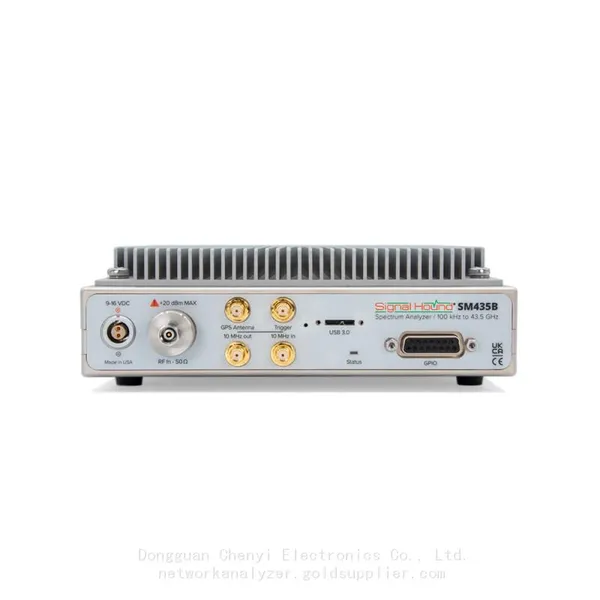
Signal Hound SM435B 100 KHz to 43.5GHz Real-time Spectrum Analyzer Monitoring ReceiversNegotiableMOQ: 1 Unit
-
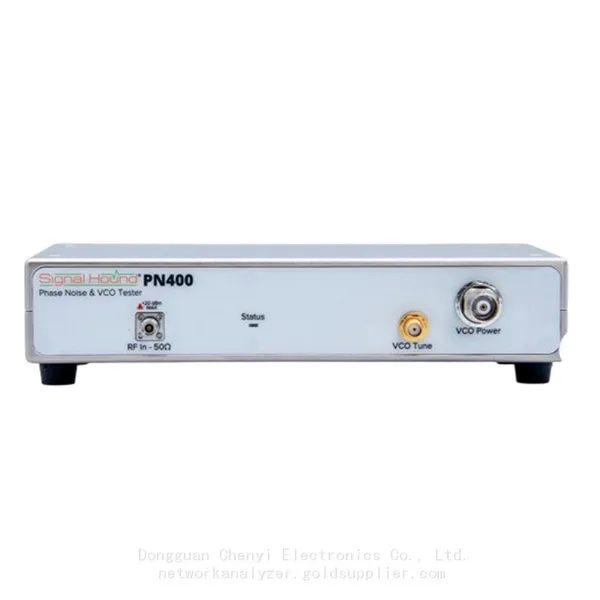
Signal Hound PN400 Phase Noise and VCO Test System 100 KHz to 43.5 GHzNegotiableMOQ: 1 Unit
-
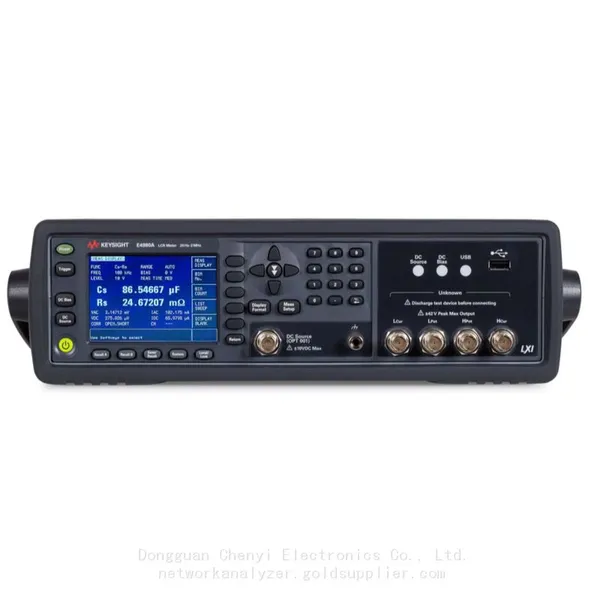
Keysight E4980A Precision LCR Meter 20 Hz to 2 MHzNegotiableMOQ: 1 Unit
-
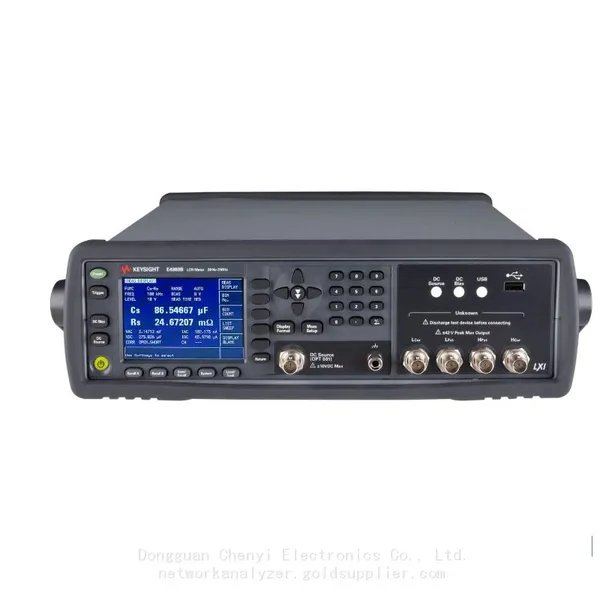
Keysight E4980B and E4980BL Precision LCR Meter 20 Hz to 2 MHzNegotiableMOQ: 1 Unit
-
Keysight U1733C Handheld LCR Meter 100Hz 120Hz 1kHz 10kHz 100kHzNegotiableMOQ: 1 Unit