
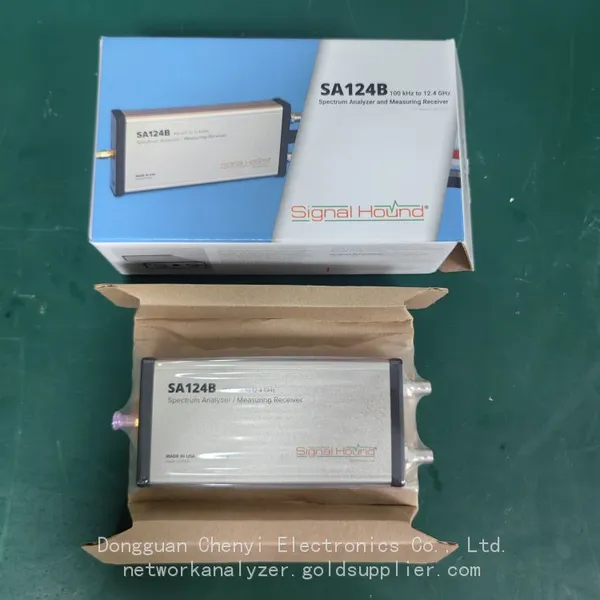
Signal Hound SA124B: Application Case in 5G Sub-6 GHz Network Testing
Signal Hound SA124B: Application Case in 5G Sub-6 GHz Network Testing
With the large-scale deployment of 5G networks, the testing and optimization of Sub-6 GHz frequency bands (e.g., 3.5 GHz, 4.9 GHz) have become critical to ensuring network performance and user experience. These bands, as the core coverage layer of 5G, face challenges such as complex urban interference environments and strict requirements for signal quality verification. A leading regional mobile network operator encountered difficulties in efficient on-site testing during its 5G Sub-6 GHz network expansion—traditional benchtop spectrum analyzers were bulky and costly, while low-frequency portable analyzers failed to cover the full Sub-6 GHz range. The Signal Hound SA124B, with its 9 kHz–12.4 GHz frequency coverage, compact USB-powered design, and professional-grade measurement performance, emerged as an ideal solution for on-site verification and interference troubleshooting. This case details the application of the SA124B in 5G Sub-6 GHz base station single-station verification and interference source localization.
1. Background & Challenges
The operator was expanding its 5G network in a medium-sized city, covering urban residential areas, commercial districts, and industrial parks. During the pre-commissioning phase of base stations, the team faced two key challenges:
• Single-Station Verification Efficiency: Each base station required verification of core indicators such as Sub-6 GHz signal coverage (RSRP), signal-to-noise ratio (SINR), and spectral mask compliance. Traditional benchtop analyzers were difficult to transport to rooftop or street-side base station sites, and the high cost limited the number of devices available for parallel testing, delaying the network deployment schedule.
• Interference Source Localization Difficulty: In the commercial district, multiple base stations reported abnormal SINR values (consistently below 10 dB), leading to reduced user data rates. Initial inspections suggested external RF interference, but conventional low-frequency analyzers could not capture interference signals in the 3.5 GHz working band, making it impossible to locate the source accurately.
The operator required a portable, cost-effective, and high-frequency-capable spectrum analysis tool to address these challenges. After evaluating multiple products, the Signal Hound SA124B was selected due to its ability to cover the full Sub-6 GHz range, low power consumption (compatible with portable battery packs), and seamless integration with Spike software for real-time data analysis.
2. Solution Design & Implementation
The project team deployed the SA124B in two core workflows: 5G Sub-6 GHz base station single-station verification and interference source localization. The test setup was standardized to ensure data accuracy and operational efficiency:
Standard Test Kit: Signal Hound SA124B spectrum analyzer, Windows 10 laptop (pre-installed with Spike software), 3.5 GHz directional antenna, 20 dB external attenuator (to protect the analyzer from high-power base station signals), portable 6000 mAh battery pack, and SMA coaxial cables. The SA124B’s USB-powered design allowed continuous operation for over 6 hours on a single battery charge, meeting the needs of all-day field testing.
2.1 5G Sub-6 GHz Single-Station Verification
The team used the SA124B to complete verification of 12 base stations across three typical scenarios (residential, commercial, industrial) following a three-step workflow:
1. Pre-Test Calibration: Before on-site testing, the SA124B was calibrated using a 10 MHz external reference oscillator to ensure frequency accuracy (±1 ppm). The team also performed a background noise scan in an open area to establish a baseline, avoiding interference from surrounding signals during subsequent tests.
2. On-Site Indicator Testing:
○ The 3.5 GHz directional antenna was pointed at the base station’s main lobe direction, and the SA124B was connected via a coaxial cable with an external attenuator (to reduce the base station’s transmit power to a safe level for the analyzer). In Spike software, the center frequency was set to 3550 MHz (the operator’s 5G working band), with a span of 100 MHz (covering the full 100 MHz bandwidth of the 5G signal) and a resolution bandwidth (RBW) of 100 kHz.
○ Key indicators were measured using Spike’s built-in tools: RSRP was derived from the peak signal power (after correcting for attenuator loss), SINR was calculated by comparing the signal power to the background noise floor, and spectral mask compliance was verified by overlaying the 3GPP TS 38.101-1 standard mask in Spike to ensure no out-of-band emissions exceeded the limit.
○ Testing was conducted at three typical points (near-field: 10 m from the base station, mid-field: 200 m, far-field: 500 m) to evaluate signal coverage consistency. Each point was measured three times, and the average value was recorded to ensure data stability.
3. Data Analysis & Reporting: Test data was exported from Spike in CSV format and integrated with the operator’s network management platform. The SA124B’s measurement data was cross-validated with professional drive-test tools, showing a deviation of less than ±1 dB for RSRP and SINR indicators, confirming the reliability of the results.
2.2 3.5 GHz Interference Source Localization
For the commercial district base stations with abnormal SINR, the SA124B was used to implement a "gradient scanning + waterfall display" interference localization strategy:
4. Interference Signal Characterization: At the problematic base station site, the SA124B was configured to scan the 3.4–3.7 GHz range (covering the entire 3.5 GHz working band) with a span of 300 MHz and RBW of 1 kHz (to enhance weak signal detection). Spike’s waterfall display was enabled with 10-second persistence to capture transient or intermittent interference signals. The scan revealed a continuous narrowband interference signal at 3520 MHz with a power level of -75 dBm, which was 20 dB higher than the normal background noise floor.
5. Gradient Scanning Localization: The team moved the SA124B-equipped test kit along the direction of increasing interference signal strength (monitored in real time via Spike’s signal strength meter). Starting from the base station, they scanned at 50-meter intervals, marking the signal power at each point. When the team approached a high-rise office building, the interference signal strength increased to -50 dBm, indicating the source was within the building.
6. Precise Source Confirmation: Inside the building, the team used the SA124B’s directional antenna to perform azimuth scanning. The interference signal was strongest near the rooftop of the 15th floor. Further inspection revealed an illegal 3.5 GHz wireless video transmission device used for construction site monitoring, which was operating without authorization and causing co-channel interference to the 5G base station.
3. Results & Value Delivered
The application of the Signal Hound SA124B achieved significant results in both single-station verification and interference troubleshooting:
3.1 Improved Single-Station Verification Efficiency
• The SA124B’s portability reduced the time required to set up each test site from 45 minutes (with benchtop analyzers) to 15 minutes. The team completed verification of 12 base stations in 3 days, compared to the previous 5-day timeline, accelerating the network deployment schedule by 40%.
• The cost of equipping the team with SA124B devices was only 15% of the cost of purchasing equivalent benchtop analyzers, significantly reducing capital expenditure while maintaining measurement accuracy.
3.2 Successful Interference Resolution
• The SA124B enabled the team to locate the illegal interference source in just 2 hours, a process that would have taken at least 8 hours with traditional equipment. After the device was shut down, the SINR values of the affected base stations returned to normal (above 20 dB), and user downlink data rates increased from an average of 200 Mbps to 800 Mbps, significantly improving service quality.
• The SA124B’s narrow RBW (down to 1 Hz) and low displayed average noise level (DANL of -145 dBm at 3.5 GHz) were critical to detecting the weak interference signal amid the complex urban RF environment.
3.3 Long-Term Operational Value
The operator integrated the SA124B into its daily network maintenance toolkit, using it for regular Sub-6 GHz signal quality monitoring and rapid interference response. The analyzer’s compatibility with Signal Hound’s SDK also allowed the team to develop custom Python scripts for automated data logging, further streamlining testing workflows.
4. Key Insights & Conclusion
This case demonstrates the unique value of the Signal Hound SA124B in 5G Sub-6 GHz network testing. Its combination of wide frequency coverage (up to 12.4 GHz), portability, and professional-grade performance addresses the core pain points of operators in field testing—low efficiency, high cost, and difficulty in interference localization. Compared to traditional tools, the SA124B balances performance and accessibility, making it an ideal choice for 5G network deployment, maintenance, and optimization.
For network operators and engineering teams engaged in 5G Sub-6 GHz projects, the SA124B provides a cost-effective and efficient testing solution that ensures network quality while accelerating deployment schedules. Its success in this case highlights its potential to become a standard tool in the 5G network testing ecosystem, supporting the stable operation and continuous optimization of 5G infrastructure.
Recently Posted
-
Cost-Benefit Analysis: Why Choose Signal Hound BB60D for RF Testing Projects
July 2, 2026Cost-Benefit Analysis: Why Choose Signal Hound BB60D for RF Testing ProjectsIn enterprise RF testing projects, laboratory scientif Read More
 -
Ultimate Buying Guide for Signal Hound BB60D Real-Time Spectrum Analyzer: Features, Uses & Benefits
July 2, 2026Ultimate Buying Guide for Signal Hound BB60D Real-Time Spectrum Analyzer: Features, Uses & BenefitsFor RF engineers, laborator Read More
 -
Common Application Scenarios & User Cases of Signal Hound BB60D Spectrum Analyzer
July 2, 2026Common Application Scenarios & User Cases of Signal Hound BB60D Spectrum AnalyzerThe Signal Hound BB60D real-time spectrum ana Read More
 -
Signal Hound BB60D for Radar Signal Analysis & Pulse Signal Testing
July 2, 2026Signal Hound BB60D for Radar Signal Analysis & Pulse Signal TestingRadar signal analysis and pulse signal testing are high-pre
Read More

Contact Us
Recommended Products
-
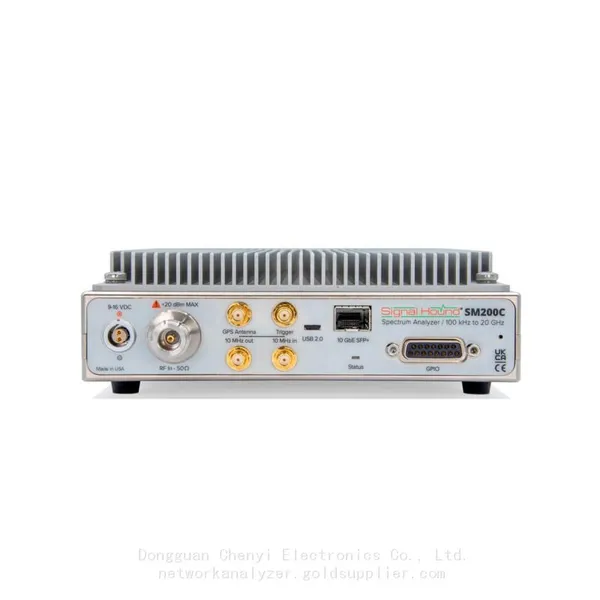
 Signal Hound SM200C 100 KHz to 20 GHz Real-time Spectrum Analyzer With 10GbE Monitoring ReceiversNegotiableMOQ: 1 Unit
 -
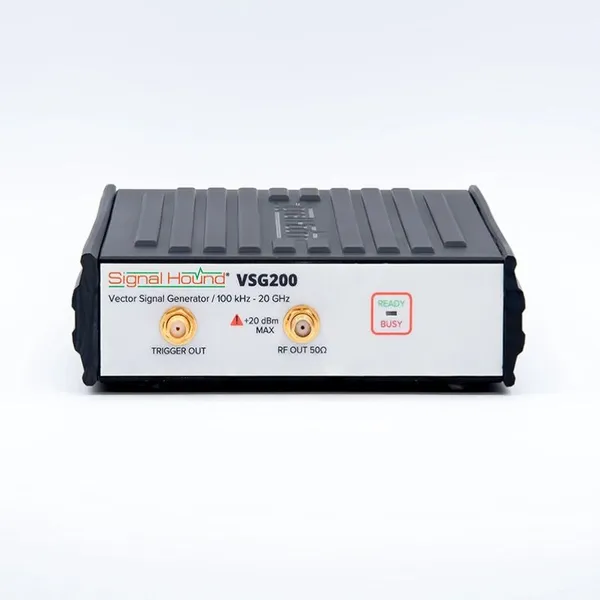
Signal Hound VSG200 Vector Signal Generator 100 KHz to 20 GHzNegotiableMOQ: 1 Unit
-
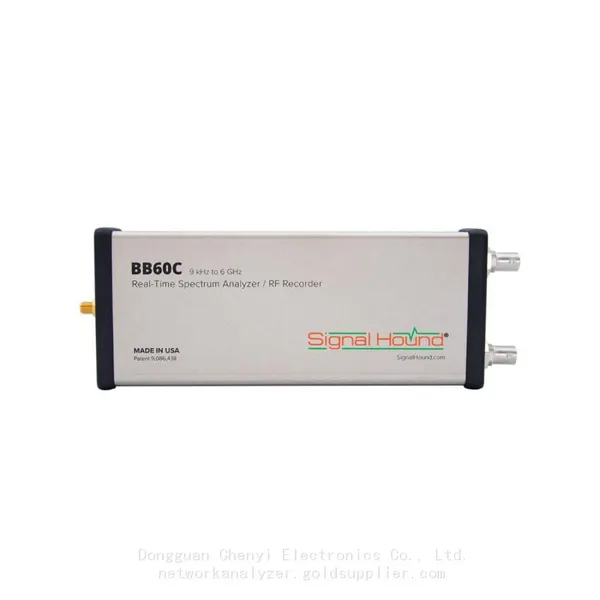
Signal Hound BB60C 9 KHz to 6 GHz Real-time Spectrum AnalyzerNegotiableMOQ: 1 Unit
-
Signal Hound BB60D 9 KHz to 6 GHz Real-time Spectrum AnalyzerNegotiableMOQ: 1 Unit
-
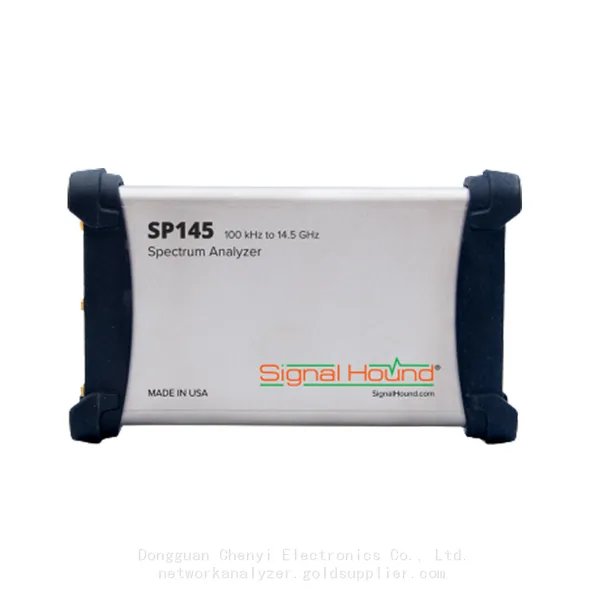
Signal Hound SP145 100 KHz to 14.5 GHz Real-time Spectrum Analyzer Monitoring ReceiversNegotiableMOQ: 1 Unit
-
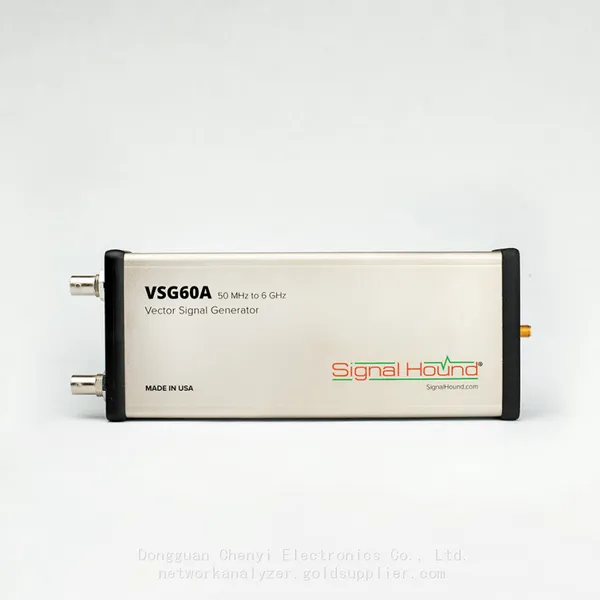
Signal Hound VSG60A 50 MHz to 6 GHz GHz Vector Signal GeneratorNegotiableMOQ: 1 Unit
-
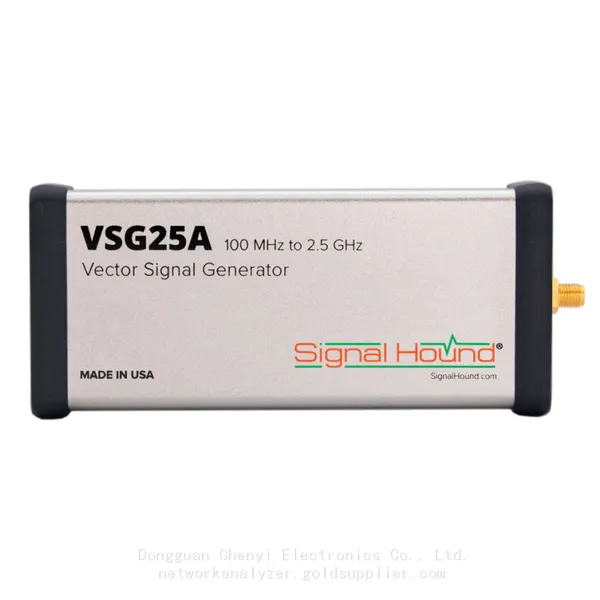
Signal Hound VSG25A 100 MHz to 2.5 GHz Vector Signal GeneratorNegotiableMOQ: 1 Unit
-
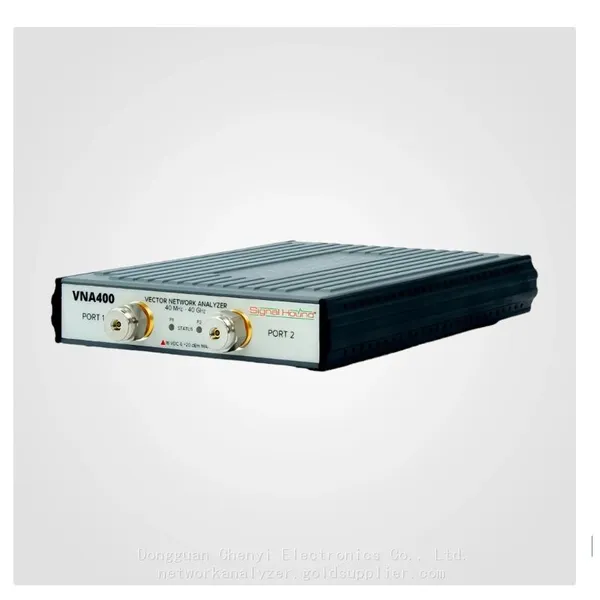
Signal Hound VNA400 40 MHz to 40 GHz 2-port Vector Network AnalyzerNegotiableMOQ: 1 Unit
-
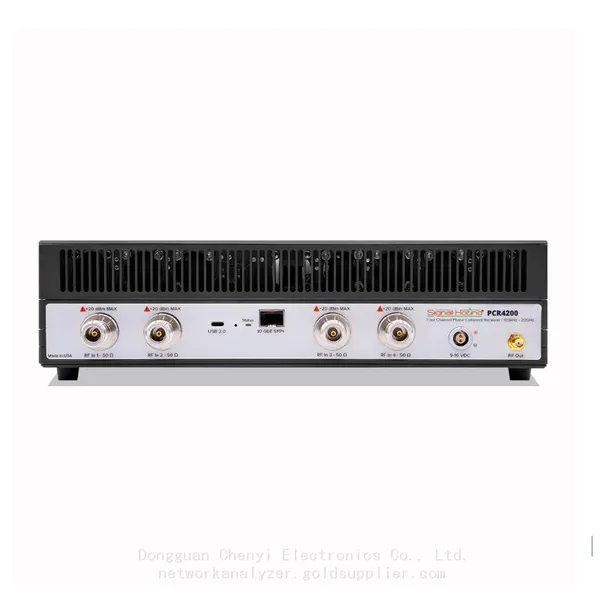
Signal Hound PCR4200 100 KHz to 20 GHz Four-Channel Phase Coherent ReceiverNegotiableMOQ: 1 Unit
-
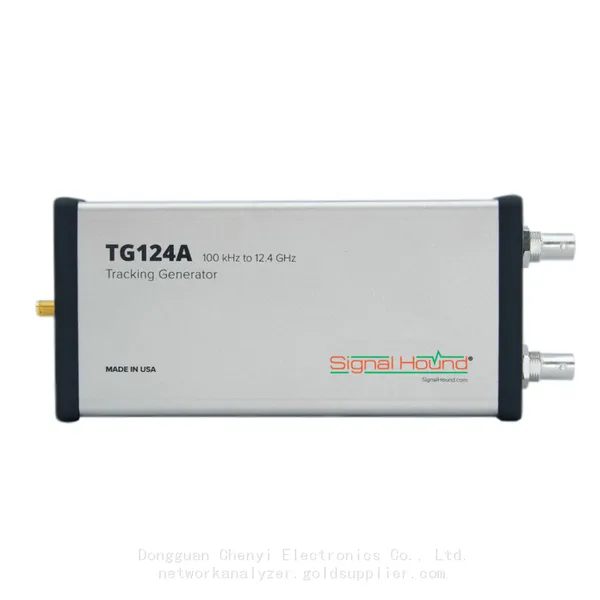
Signal Hound TG124A 100 KHz to 12.4 GHz Tracking GeneratorNegotiableMOQ: 1 Unit
-
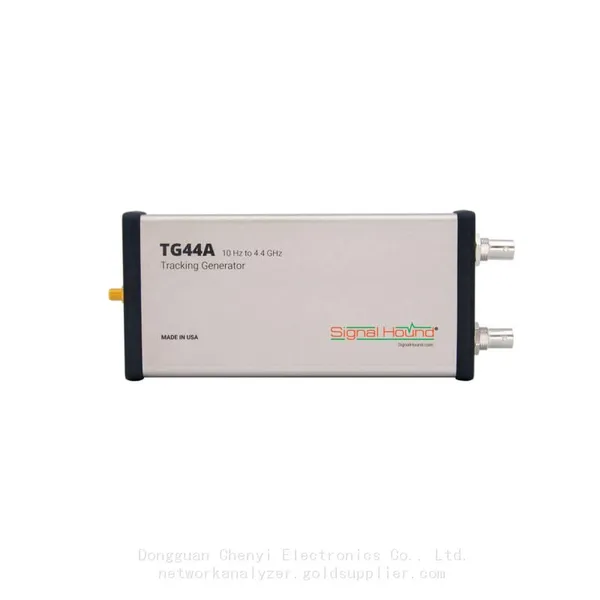
Signal Hound TG44A 10 Hz to 4.4 GHz t Tracking GeneratorNegotiableMOQ: 1 Unit
-
Signal Hound SA124B 100 KHz to 12.4 GHz Spectrum AnalyzerNegotiableMOQ: 1 Unit
-
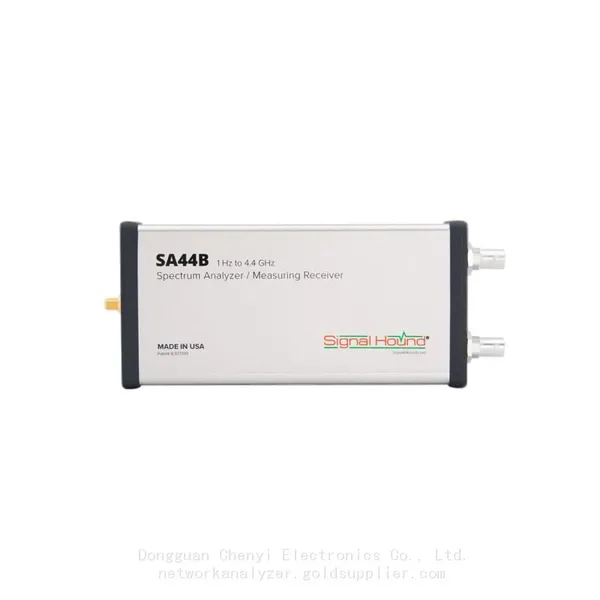
Signal Hound SA44B 1 Hz to 4.4 GHz Spectrum AnalyzerNegotiableMOQ: 1 Unit
-
Signal Hound SM200B 100 KHz to 20 GHz Real-time Spectrum Analyzer Monitoring ReceiversNegotiableMOQ: 1 Unit
-
Signal Hound SM435C 100 KHz to 43.5GHz Real-time Spectrum Analyzer With 10GbE Monitoring ReceiversNegotiableMOQ: 1 Unit
-
Signal Hound SM435B 100 KHz to 43.5GHz Real-time Spectrum Analyzer Monitoring ReceiversNegotiableMOQ: 1 Unit
-
Signal Hound PN400 Phase Noise and VCO Test System 100 KHz to 43.5 GHzNegotiableMOQ: 1 Unit
-
Keysight E4980A Precision LCR Meter 20 Hz to 2 MHzNegotiableMOQ: 1 Unit
-
Keysight E4980B and E4980BL Precision LCR Meter 20 Hz to 2 MHzNegotiableMOQ: 1 Unit
-
Keysight U1733C Handheld LCR Meter 100Hz 120Hz 1kHz 10kHz 100kHzNegotiableMOQ: 1 Unit