
 Business License

Understanding Spectrum Analyzer Key Specifications: DANL, Phase Noise, TOI, and RBW
1. The Specification That Cost Two Weeks of Debugging
An RF design team spent two weeks trying to measure the third harmonic of a 2.4 GHz transmitter at a level their link budget predicted should be roughly -55 dBm. Their spectrum analyzer showed nothing but noise at the expected frequency. The problem was not the transmitter. The analyzer's displayed average noise level specification was -145 dBm/Hz, which the team assumed meant they could see any signal above roughly -145 dBm. They had not accounted for the 10 dB of attenuation from the input pad, the 3 dB noise figure of the internal preamplifier, and the fact that the harmonic fell more than 2 GHz above the analyzer's optimal frequency range where sensitivity degraded by an additional 6 dB. The actual noise floor at the measurement frequency was roughly -126 dBm, and the -55 dBm harmonic was 71 dB above it and perfectly measurable once the team configured the instrument correctly.
Spectrum analyzer datasheets are dense with specifications that interact in ways that are not always obvious. Understanding what each parameter means, how they relate to each other, and how measurement setup affects real-world performance turns a confusing datasheet into a reliable predictor of what the instrument can and cannot measure. This article explains the four most important spectrum analyzer specifications: DANL, phase noise, TOI, and RBW.
2. Displayed Average Noise Level: The Sensitivity Floor
DANL, or displayed average noise level, is the spectrum analyzer's internal noise floor expressed as power per unit bandwidth, typically dBm/Hz. It defines the weakest signal the analyzer can detect when no external attenuation is applied and the preamplifier is switched on if available. A typical mid-range spectrum analyzer might specify a DANL of roughly -155 dBm/Hz at 1 GHz, while a high-performance instrument reaches -165 dBm/Hz or better.
The key insight about DANL is that it scales with resolution bandwidth. The noise power the analyzer displays is the integrated noise across the RBW filter. A 10 Hz RBW integrates 10 Hz of noise bandwidth, while a 1 kHz RBW integrates 1,000 Hz. The noise power increases by 10 dB for every 10x increase in RBW. An analyzer with a DANL of -155 dBm/Hz shows a noise floor of roughly -145 dBm with a 10 Hz RBW, -135 dBm with a 100 Hz RBW, and -125 dBm with a 1 kHz RBW.
This RBW dependence means that DANL alone does not tell you what signals you can see. You must also consider the RBW you will use for the measurement. A narrow RBW lowers the noise floor but increases sweep time. A wide RBW speeds up the sweep but raises the noise floor. The trade-off between sensitivity and speed is fundamental to spectrum analyzer operation and is not something any DSP algorithm can eliminate.
3. External Factors That Raise the Noise Floor
Several factors beyond the analyzer's internal DANL determine the real-world noise floor. Input attenuation is the most common. Every 1 dB of input attenuation raises the noise floor by 1 dB because the attenuator reduces the signal before the first amplifier, while the amplifier's own noise remains constant. An analyzer with -155 dBm/Hz DANL and 20 dB of input attenuation has an effective noise floor of -135 dBm/Hz. Many engineers leave the default 10 dB or 20 dB of attenuation in place without realizing the sensitivity penalty.
The preamplifier, when available, improves DANL by reducing the system noise figure. A preamplifier with 20 dB of gain and a 5 dB noise figure can improve the system DANL by roughly 10 to 15 dB, depending on the analyzer's native noise figure. The trade-off is reduced dynamic range because the preamplifier also amplifies strong signals that can compress the mixer or generate spurious responses. Most spectrum analyzers automatically switch the preamplifier in and out based on the reference level setting, but the engineer should understand what the instrument is doing and when to override the automatic selection.
Frequency also affects DANL. Every spectrum analyzer has a frequency range over which its sensitivity is specified and typically a wider range over which it operates with degraded sensitivity. The DANL at 6 GHz may be 3 to 6 dB worse than at 1 GHz. Above roughly 7 GHz to 10 GHz, many analyzers switch to harmonic mixing, which further degrades sensitivity by 10 to 15 dB. If your measurement frequencies span different bands, check the DANL specification at each band, not just the headline number.
4. Phase Noise: Why a Clean Local Oscillator Matters
Phase noise is the short-term frequency instability of the spectrum analyzer's internal local oscillator. It appears as noise sidebands around any displayed signal and limits the analyzer's ability to measure a weak signal close to a strong one. The specification is typically given as dBc/Hz at a specified offset from the carrier, with common offsets being 1 kHz, 10 kHz, 100 kHz, and 1 MHz.
The table below shows typical phase noise specifications across instrument tiers at a 1 GHz carrier with a 10 kHz offset.
| Instrument Tier | Phase Noise at 10 kHz Offset | Implication |
|---|---|---|
| Entry-level USB analyzer | Roughly -90 to -95 dBc/Hz | Adequate for general-purpose measurements |
| Mid-range portable analyzer | Roughly -100 to -108 dBc/Hz | Can measure adjacent-channel power for most wireless standards |
| High-performance benchtop | Roughly -115 to -125 dBc/Hz | Suitable for oscillator characterization and close-in spur measurement |
| Dedicated phase noise tester | Better than -130 dBc/Hz | Required for ultra-low-jitter reference oscillator verification |
Phase noise matters whenever you need to measure a small signal near a large one. In a receiver test, the analyzer's own phase noise can mask the receiver's noise figure if the LO phase noise sidebands from the input test signal are higher than the receiver's actual noise floor. In an adjacent-channel power measurement for a cellular base station, the analyzer's phase noise must be at least 10 dB better than the ACPR specification being measured. Otherwise, the analyzer contributes more noise than the device under test, and the measurement reports the analyzer's limitation rather than the transmitter's performance.
5. Third-Order Intercept Point: The Distortion Ceiling
TOI, or third-order intercept point, quantifies the analyzer's linearity. When two closely spaced tones enter a nonlinear device, they generate third-order intermodulation products at frequencies of 2f1 minus f2 and 2f2 minus f1. In a spectrum analyzer, these IM3 products come from the mixer and the input amplifier. TOI is the extrapolated power level at which the third-order products would equal the fundamental tones, though real instruments compress well before reaching that point.
For a typical spectrum analyzer, TOI is specified at roughly +10 dBm to +20 dBm for the input mixer. This means that with two tones at -20 dBm each, the IM3 products appear roughly 60 dB below the tones for a +10 dBm TOI instrument. Increase the tones to -10 dBm, and the IM3 products rise to only 40 dB below.
The practical effect of TOI is an upper dynamic range limit. DANL defines the lower limit of what the analyzer can measure, and TOI defines the upper limit before the analyzer generates signals of its own that can be confused with real signals. The dynamic range between DANL and TOI, when both are normalized to the same bandwidth, is typically roughly 80 to 95 dB for a quality analyzer. When you see unexpected signals on the display that do not change when you disconnect the input, you are likely seeing internally generated intermodulation products from signals overdriving the mixer.
6. Resolution Bandwidth: The Selectivity Filter
RBW is the bandwidth of the final IF filter in a swept analyzer or the equivalent noise bandwidth of the FFT bin in a real-time analyzer. It determines the analyzer's ability to separate two closely spaced signals. Two CW tones separated by 10 kHz are resolved as two distinct peaks only if the RBW is substantially narrower than 10 kHz, typically 3 kHz or less for clear separation.
The selectivity, or shape factor, of the RBW filter determines how sharply it rolls off. It is specified as the ratio of the filter's 60 dB bandwidth to its 3 dB bandwidth. A shape factor of 5:1 means the filter is five times wider at 60 dB down than at 3 dB down. Digital IF filters achieve shape factors of roughly 4:1 to 5:1, while analog filters in older instruments were closer to 15:1. Better shape factor means the analyzer can separate signals that are closer together in both frequency and amplitude.
The relationship between RBW, sweep time, and span is governed by the sweep equation. For a given span and RBW, the minimum sweep time is proportional to span divided by RBW squared. Narrowing the RBW by a factor of 10 increases the required sweep time by a factor of 100. This is why real-time analyzers with wide instantaneous bandwidth and FFT processing can be dramatically faster for wide-span measurements: they process the entire span in parallel rather than sweeping through it sequentially.
7. How the Specifications Interact in Practice
No single specification determines an analyzer's suitability for a measurement. The four parameters described here interact, and the limiting factor depends on the specific measurement. The following table illustrates this interaction for three common measurement scenarios.
| Measurement Scenario | Primary Limiting Spec | Secondary Concern | Mitigation Strategy |
|---|---|---|---|
| Weak signal near noise floor | DANL | RBW setting | Reduce RBW, use preamp, minimize attenuation |
| Small signal near large signal | Phase noise | TOI | Use narrower RBW, add external notch filter on large signal |
| Two-tone intermodulation test | TOI | DANL | Keep input tones low enough to avoid analyzer-generated IM3 |
| Adjacent channel power | Phase noise + DANL | RBW flatness | Use RMS detector, verify analyzer noise contribution |
A while back, an RF test engineer at a contract manufacturer in Vietnam was evaluating spectrum analyzers for a production line testing 5.8 GHz ISM band modules. Their product specification required measuring spurious emissions at -50 dBm while a +20 dBm carrier was present on the adjacent channel. Dongguan Chenyi Electronics walked the engineer through the calculation: the analyzer needed phase noise better than -110 dBc/Hz at the channel spacing to keep the LO noise sidebands from the +20 dBm carrier below the -50 dBm measurement threshold. Several analyzers with adequate DANL failed this requirement because their phase noise was insufficient. The recommended instrument met both specs, and the production line achieved a first-pass yield improvement of roughly 4% because the measurements were now limited by the product rather than the test equipment.
8. Reading a Datasheet With a Critical Eye
Manufacturers present specifications in ways that favor their instruments. DANL is often quoted at 1 GHz with 0 dB attenuation and the preamplifier on, the most favorable conditions. Phase noise may be quoted at a 1 GHz carrier where performance is optimal, not at 6 GHz or 20 GHz where it degrades. TOI is typically quoted at the mixer input with minimum attenuation, not at the full signal path including the preamplifier.
When comparing instruments, normalize the specifications to a common set of conditions. What is the DANL at your measurement frequency with 10 dB of input attenuation? What is the phase noise at a 100 kHz offset rather than 10 kHz if your adjacent-channel spacing is 200 kHz? What is the TOI with the preamplifier engaged if your measurements require the preamp for sensitivity? The answers to these questions, not the headline numbers on the first page of the datasheet, determine whether the instrument will work for your application.
At Dongguan Chenyi Electronics, we maintain a comparison database that normalizes specifications across the instruments we carry, so that customers can see apples-to-apples performance at their specific measurement conditions. This approach has saved buyers from purchasing instruments that looked good on the datasheet but could not perform the required measurement in practice.
Another example comes from an engineering school that purchased spectrum analyzers for a senior-level RF design lab. The instruments were selected based on frequency range and DANL, but the phase noise at 10 kHz offset was roughly -88 dBc/Hz. When students attempted to measure the phase noise of their PLL designs, which had target specifications of roughly -95 dBc/Hz at 10 kHz offset, the analyzer's own phase noise dominated the measurement. The lab replaced two of the instruments with units offering roughly -105 dBc/Hz phase noise, sourced through Chenyi Electronics, and the remaining older units were reassigned to harmonic and power measurement labs where phase noise was not critical.
9. Frequently Asked Questions
9.1 How do I know if my analyzer's noise floor is limiting my measurement?
Disconnect the input signal and observe the displayed noise floor with your planned measurement settings. If the noise floor is within 10 dB of the signal level you need to measure, the analyzer is contributing significant uncertainty. For a reliable measurement, the signal should be at least 10 dB above the noise floor, and ideally 20 dB or more. If the margin is insufficient, reduce the RBW by a factor of 10 for roughly 10 dB of noise floor improvement, use the preamplifier if available, and minimize input attenuation.
9.2 What specification matters most for EMI pre-compliance testing?
DANL is the critical specification for EMI testing because you are looking for low-level emissions across wide frequency spans. A DANL of roughly -155 dBm/Hz or better at 1 GHz, combined with the ability to operate at narrow RBWs down to 10 Hz or less, provides the sensitivity needed to detect emissions at typical regulatory limits. Phase noise matters for accurate amplitude measurement of narrowband emissions, and real-time bandwidth determines your ability to capture intermittent emissions.
9.3 Can I improve my analyzer's phase noise with external filtering?
You cannot improve the analyzer's own LO phase noise, but you can filter the input signal to reduce the amplitude of the strong carrier that generates the phase noise sidebands you are fighting. A notch filter at the carrier frequency, placed before the analyzer input, reduces the carrier power by 20 to 40 dB and correspondingly reduces the phase noise sidebands by the same amount. This technique is standard for two-tone and adjacent-channel measurements where one signal is much stronger than the other.
9.4 Why do real-time analyzers have higher DANL than swept analyzers?
The wideband ADC in a real-time analyzer digitizes the entire real-time bandwidth simultaneously, so the quantization noise is spread across that full bandwidth. A swept analyzer digitizes only the narrow RBW bandwidth after filtering, so the noise per unit bandwidth is lower. This is the fundamental trade-off between real-time gap-free processing and swept narrowband sensitivity. For most applications, the RTSA's DANL is still adequate, and the ability to see transient signals compensates for the noise floor difference.
Recently Posted
-
Real-Time Spectrum Analyzer vs Traditional Swept Spectrum Analyzer: Which One Fits Modern RF Testing
August 13, 20261. The Purchase Decision That Engineers Keep Getting WrongA test equipment manager at a contract manufacturer ordered three tradit Read More
 -
What Is a Real-Time Spectrum Analyzer? A Beginner's Guide for RF Engineers
August 11, 20261. Why Spectrum Analysis Goes Beyond Simple Power MeasurementA team at a wireless module factory spent three weeks chasing an inte Read More
 -
Signal Hound SM200B for University RF Laboratory Teaching & Scientific Research
July 20, 2026Signal Hound SM200B for University RF Laboratory Teaching & Scientific ResearchUniversity electronic information, communicatio Read More
 -
Why Signal Hound SM200B is the Best Portable Monitoring Receiver for 5G RF Testing
July 15, 2026Why Signal Hound SM200B is the Best Portable Monitoring Receiver for 5G RF TestingWith the rapid global popularization of 5G commu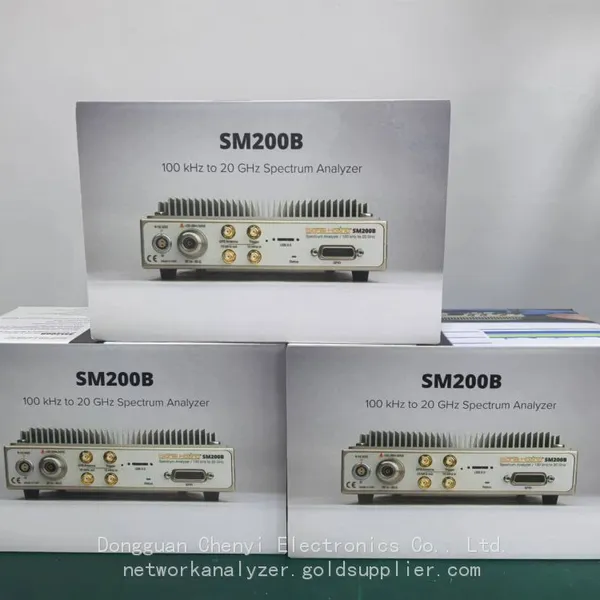 Read More

Contact Us
Recommended Products
-
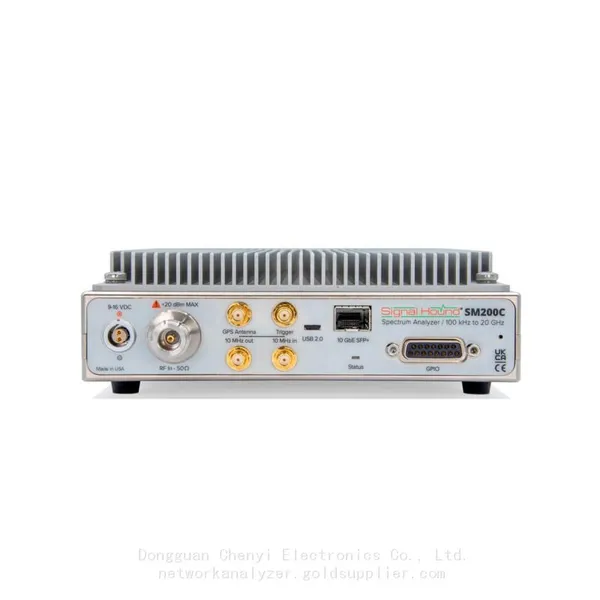
 Signal Hound SM200C 100 KHz to 20 GHz Real-time Spectrum Analyzer With 10GbE Monitoring ReceiversNegotiableMOQ: 1 Unit
 -
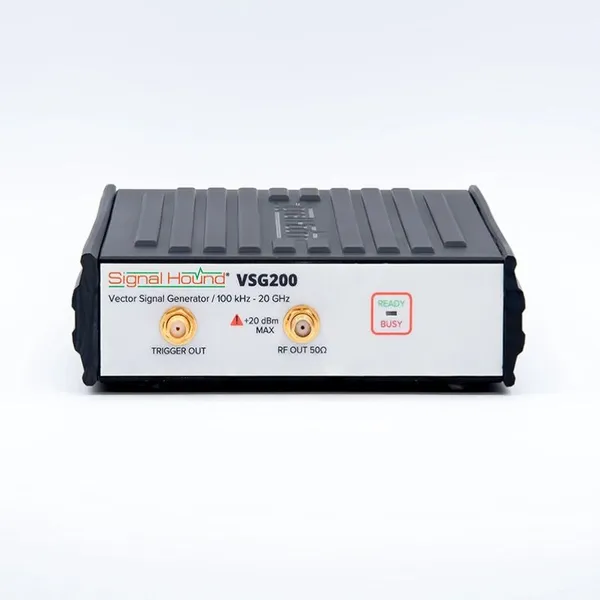
Signal Hound VSG200 Vector Signal Generator 100 KHz to 20 GHzNegotiableMOQ: 1 Unit
-
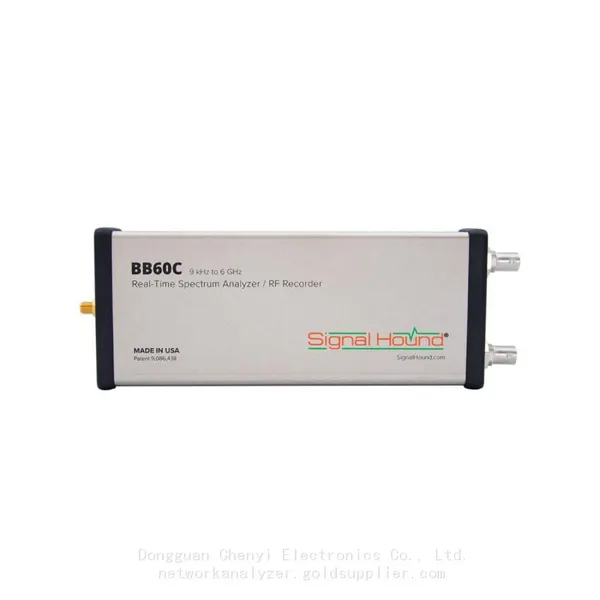
Signal Hound BB60C 9 KHz to 6 GHz Real-time Spectrum AnalyzerNegotiableMOQ: 1 Unit
-
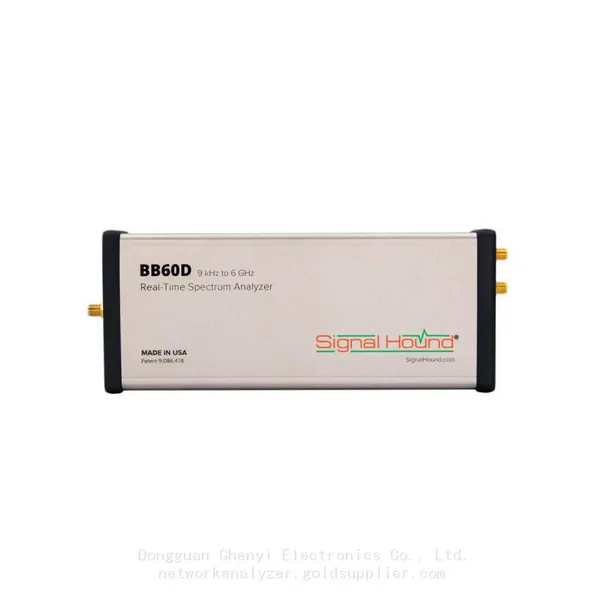
Signal Hound BB60D 9 KHz to 6 GHz Real-time Spectrum AnalyzerNegotiableMOQ: 1 Unit
-
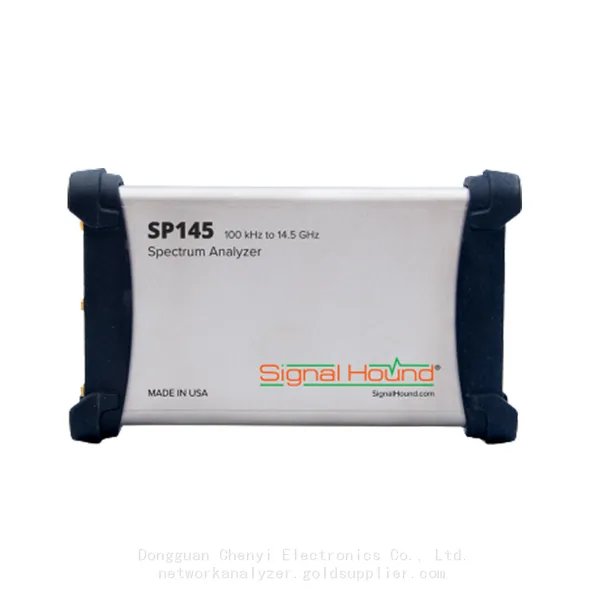
Signal Hound SP145 100 KHz to 14.5 GHz Real-time Spectrum Analyzer Monitoring ReceiversNegotiableMOQ: 1 Unit
-
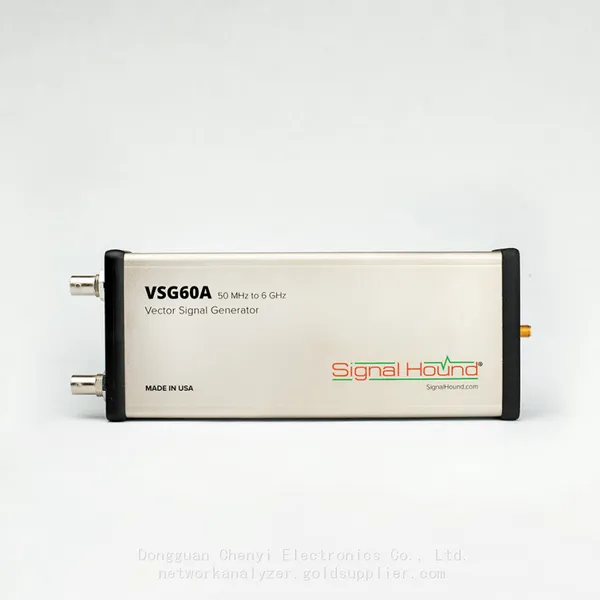
Signal Hound VSG60A 50 MHz to 6 GHz GHz Vector Signal GeneratorNegotiableMOQ: 1 Unit
-
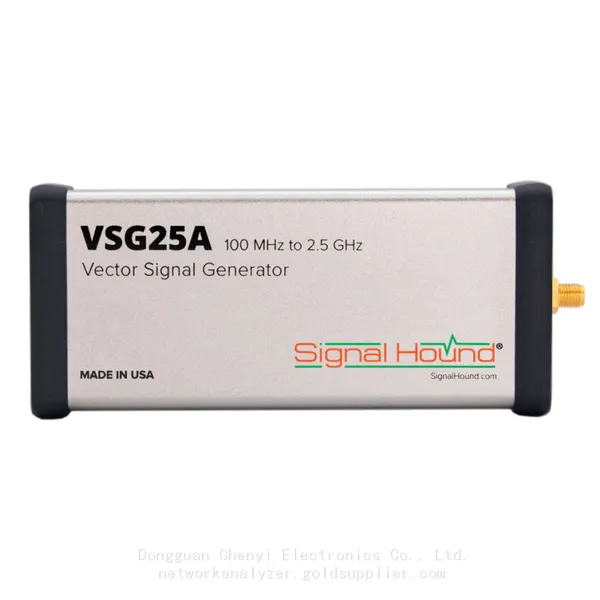
Signal Hound VSG25A 100 MHz to 2.5 GHz Vector Signal GeneratorNegotiableMOQ: 1 Unit
-
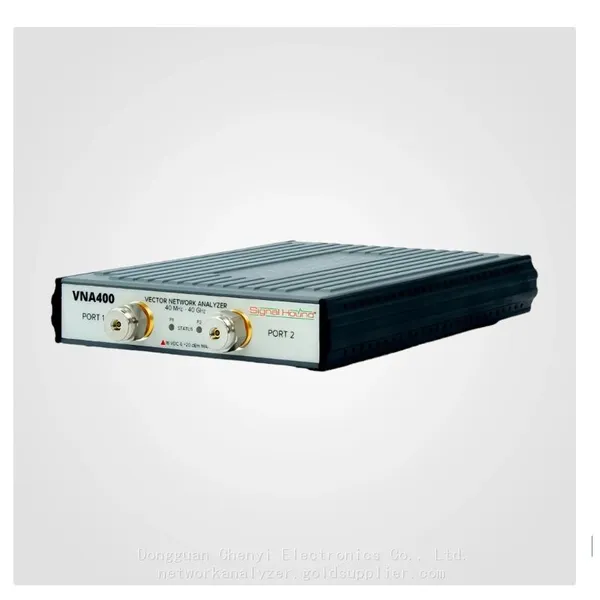
Signal Hound VNA400 40 MHz to 40 GHz 2-port Vector Network AnalyzerNegotiableMOQ: 1 Unit
-
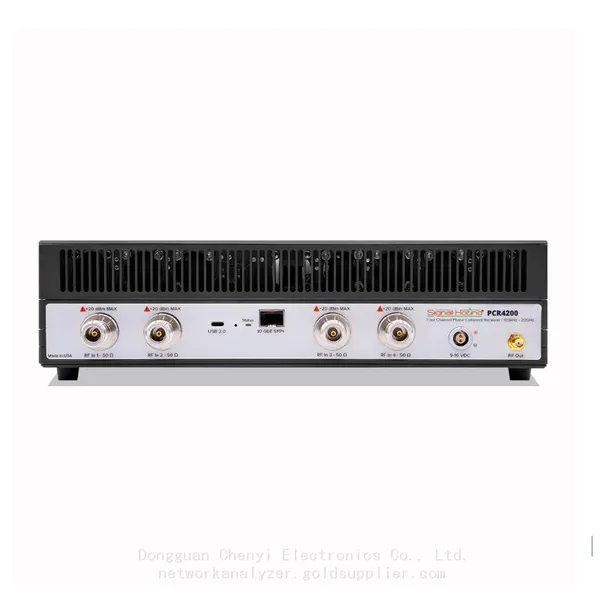
Signal Hound PCR4200 100 KHz to 20 GHz Four-Channel Phase Coherent ReceiverNegotiableMOQ: 1 Unit
-
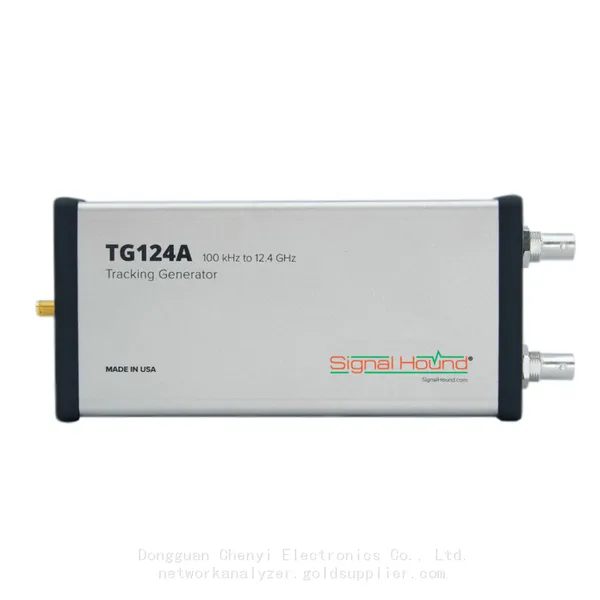
Signal Hound TG124A 100 KHz to 12.4 GHz Tracking GeneratorNegotiableMOQ: 1 Unit
-
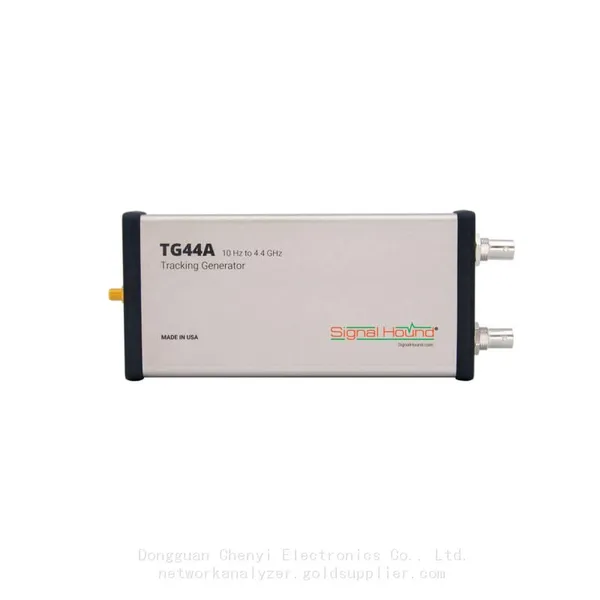
Signal Hound TG44A 10 Hz to 4.4 GHz t Tracking GeneratorNegotiableMOQ: 1 Unit
-
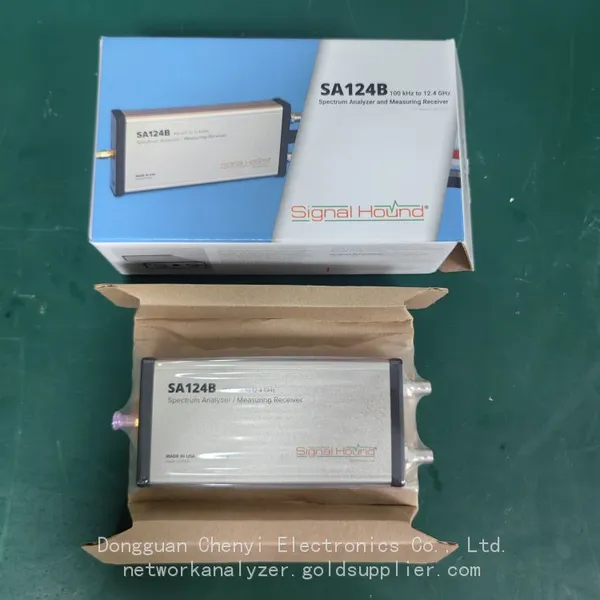
Signal Hound SA124B 100 KHz to 12.4 GHz Spectrum AnalyzerNegotiableMOQ: 1 Unit
-
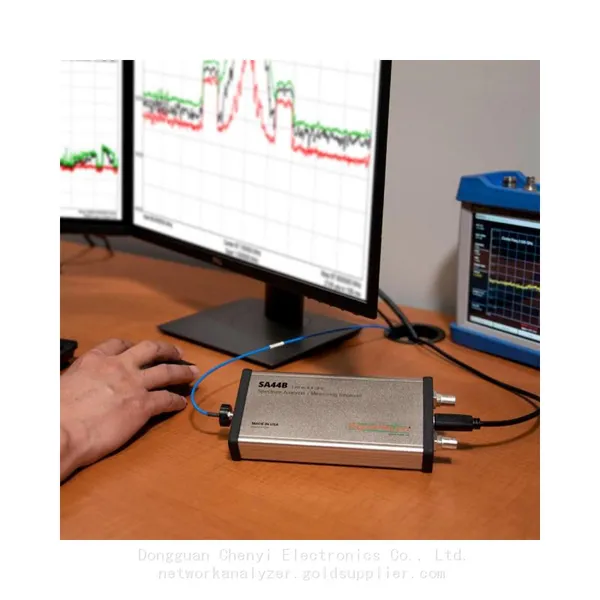
Signal Hound SA44B 1 Hz to 4.4 GHz Spectrum AnalyzerNegotiableMOQ: 1 Unit
-
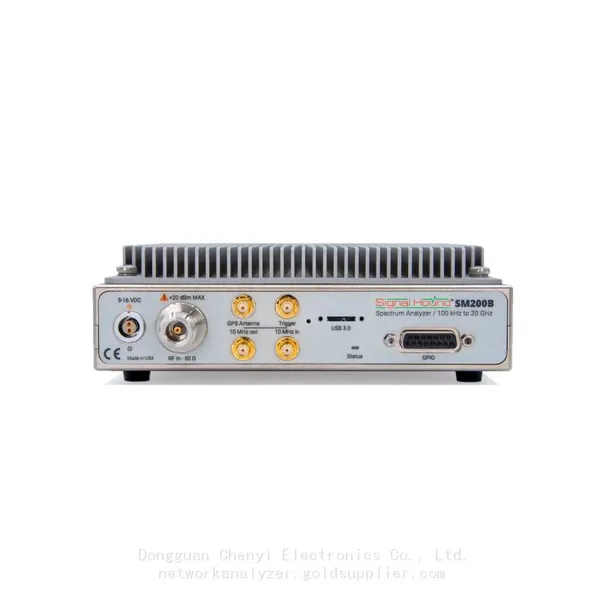
Signal Hound SM200B 100 KHz to 20 GHz Real-time Spectrum Analyzer Monitoring ReceiversNegotiableMOQ: 1 Unit
-
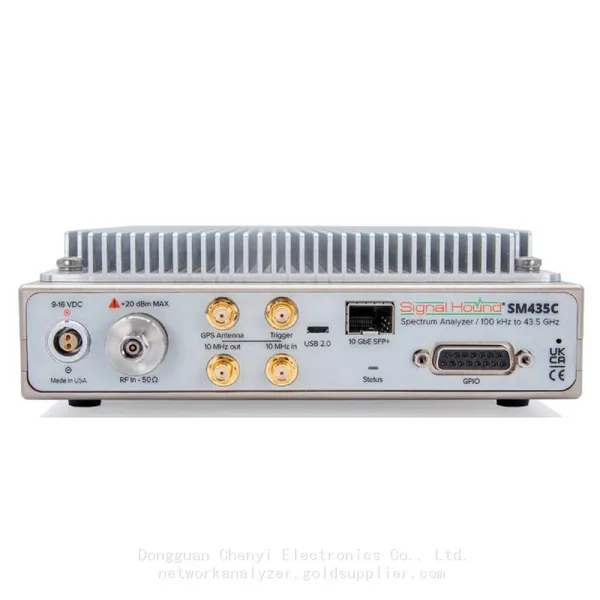
Signal Hound SM435C 100 KHz to 43.5GHz Real-time Spectrum Analyzer With 10GbE Monitoring ReceiversNegotiableMOQ: 1 Unit
-
Signal Hound SM435B 100 KHz to 43.5GHz Real-time Spectrum Analyzer Monitoring ReceiversNegotiableMOQ: 1 Unit
-
Signal Hound PN400 Phase Noise and VCO Test System 100 KHz to 43.5 GHzNegotiableMOQ: 1 Unit
-
Keysight E4980A Precision LCR Meter 20 Hz to 2 MHzNegotiableMOQ: 1 Unit
-
Keysight E4980B and E4980BL Precision LCR Meter 20 Hz to 2 MHzNegotiableMOQ: 1 Unit
-
Keysight U1733C Handheld LCR Meter 100Hz 120Hz 1kHz 10kHz 100kHzNegotiableMOQ: 1 Unit