
 Business License

What Is a Real-Time Spectrum Analyzer? A Beginner's Guide for RF Engineers
1. Why Spectrum Analysis Goes Beyond Simple Power Measurement
A team at a wireless module factory spent three weeks chasing an intermittent failure. Their product passed every bench test, yet roughly 1 out of every 200 units failed in the field. The lab's swept spectrum analyzer showed nothing unusual. Only after borrowing a real-time spectrum analyzer did they spot the culprit: a 12-microsecond interference burst from a switching power supply that fired irregularly, once every few seconds. The traditional analyzer had simply never swept past the right frequency at the right moment.
This scenario is far more common than many engineers realize. RF signals in the real world are rarely stable, predictable, and continuous. They hop, pulse, burst, chirp, and flicker. Understanding what a spectrum analyzer can and cannot capture is the first step toward choosing the right tool for a given measurement task.
This article explains what a real-time spectrum analyzer really is, how it differs from the swept analyzers most engineers learned on, and when the investment in real-time capability actually pays off. We will cover the underlying architecture, key performance metrics, common use cases, and practical selection factors.
2. How a Traditional Swept Spectrum Analyzer Works
To understand real-time analysis, it helps to first understand what it replaces. A traditional swept-tuned spectrum analyzer, often called a superheterodyne analyzer, works by sweeping a local oscillator across the frequency range of interest. At each step, a narrow resolution bandwidth filter measures the power present at that specific frequency, then the instrument moves to the next step. A full-span sweep from 9 kHz to 6 GHz on an older swept analyzer might take roughly 5 to 10 seconds depending on resolution bandwidth and span settings.
This architecture has served the RF industry for decades and remains adequate for many tasks. Measuring the output power of a CW transmitter, checking harmonic levels, or characterizing a stable amplifier's frequency response all work well with a swept analyzer. The problem emerges when the signal under test changes faster than the sweep can cover the span.
Think of a swept analyzer as a photographer taking a long-exposure panorama by panning the camera slowly across a scene. If something moves during the exposure, it blurs or disappears entirely. A real-time analyzer, by contrast, takes a continuous burst of high-speed snapshots that together form a complete motion picture of the spectrum.
3. The Fundamental Flaw of Swept Analysis: Missing Transient Signals
Every swept analyzer has a dead time problem. Even a fast modern swept analyzer spends the vast majority of its measurement cycle tuned to frequencies other than the one carrying a transient event. If a pulsed radar signal appears for 10 microseconds at 3.5 GHz while the analyzer is sweeping through 1.2 GHz, the event is invisible. The analyzer simply is not listening at 3.5 GHz at that instant.
The probability of intercept, or POI, quantifies this blind-spot effect. For a traditional swept analyzer, the POI for a signal shorter than the sweep time is roughly the ratio of the signal duration divided by the total sweep time. A 10-microsecond pulse on a 5-second sweep has a POI of roughly 0.0002%, which means the analyzer will miss it nearly every time. For signals below roughly 100 microseconds in duration, a swept analyzer becomes effectively blind across wide spans.
This matters far beyond radar testing. Bluetooth frequency-hopping signals change channels 1,600 times per second. Wi-Fi beacons appear briefly and unpredictably. EMI from digital circuits produces narrow, fast glitches. Interference from nearby transmitters may appear, cause a problem, and vanish within milliseconds.
4. What Makes a Spectrum Analyzer "Real-Time"
A real-time spectrum analyzer solves the dead-time problem by processing the entire bandwidth of interest continuously, without gaps. Instead of sweeping a narrow filter across the span, an RTSA digitizes a wide block of spectrum all at once and computes the frequency-domain representation using the Fast Fourier Transform. As long as the FFT computation rate keeps up with the acquisition rate, no signal within the instrument's real-time bandwidth is ever missed.
The definition of real-time in this context is specific and measurable: an analyzer is real-time when it can compute FFTs faster than new time-domain samples arrive, so that every sample contributes to at least one spectrum result. This is called gap-free processing. If the DSP engine falls behind and must drop samples between FFT frames, the instrument reverts to what is essentially a fast swept mode with improved but not gap-free coverage.
Real-time bandwidth, typically specified in megahertz, defines the instantaneous span that can be processed gap-free. Entry-level USB RTSAs might offer roughly 10 MHz to 27 MHz. Mid-range portable units typically provide around 40 MHz to 100 MHz. High-end rack-mount instruments can reach 160 MHz to 500 MHz or wider, though at a corresponding increase in cost and power consumption.
5. The FPGA Engine: Digital Backbone of Real-Time Processing
Behind every real-time spectrum analyzer is a field-programmable gate array (FPGA) running a high-speed FFT pipeline. The incoming RF signal passes through an analog downconverter, is digitized by a high-speed ADC, and then enters the FPGA. Inside the FPGA, the digitized samples are windowed, transformed into the frequency domain, and accumulated into spectral displays at rates that can exceed 100,000 FFTs per second.
This FPGA-centric architecture is what distinguishes an RTSA from a traditional swept analyzer with an FFT option. A swept analyzer that offers an FFT mode still processes sequential blocks of spectrum one at a time with gaps between them. The RTSA's FPGA pipeline is designed from the ground up to sustain continuous, overlapping, gap-free processing across the full real-time bandwidth.
The trade-off for this processing power is primarily in cost, power consumption, and instantaneous dynamic range. The wideband ADC and FPGA consume more power than the narrowband IF chain of a swept analyzer. The ADC's effective number of bits at wide bandwidths also limits the spurious-free dynamic range compared to what a swept analyzer achieves through narrowband filtering. For most field and production-test applications, however, the dynamic range of a modern RTSA is more than adequate, while the ability to see transient events is indispensable.
6. Key Performance Metrics: POI, Bandwidth, and Dynamic Range
Selecting a real-time spectrum analyzer requires understanding a handful of parameters that define its capability for a given application. The table below summarizes the key metrics and what they mean in practice.
| Metric | What It Measures | Typical Entry-Level Value | Typical High-End Value |
|---|---|---|---|
| Real-Time Bandwidth | Instantaneous spectrum span processed gap-free | 10 MHz to 27 MHz | 100 MHz to 500 MHz |
| 100% POI Duration | Shortest signal guaranteed to be captured at 100% probability | Roughly 10 to 15 microseconds | Under 1 microsecond |
| DANL (Displayed Average Noise Level) | Sensitivity floor of the instrument | -150 to -160 dBm/Hz | -165 to -170 dBm/Hz |
| SFDR (Spurious-Free Dynamic Range) | Difference between largest and smallest detectable signals without self-generated spurs | 60 to 75 dB | 80 to 100 dB |
| Frequency Range | Total tunable span of the instrument | 9 kHz to 6 GHz | 9 kHz to 43.5 GHz or higher |
| FFT Rate | Number of spectra computed per second | 10,000 to 40,000/sec | Over 100,000/sec |
The POI spec deserves particular attention because it defines whether an RTSA can actually catch the signals you care about. If your application involves Wi-Fi preambles lasting roughly 40 microseconds, an RTSA with a 15-microsecond POI will see every single one. An instrument with a 50-microsecond POI will miss some. Always check the 100% POI specification at the full real-time bandwidth, not at a reduced span, when comparing instruments.
7. Display Modes That Make RTSAs Different
The real-time processing pipeline of an RTSA enables display modes that a swept analyzer cannot replicate. These displays turn the high-speed FFT stream into visual information that reveals signal behavior invisible to traditional instruments.
The persistence display overlays thousands of sequential spectra using color to encode how often energy appears at each frequency and amplitude. A continuous CW signal shows up as a thin, bright line. A frequency-hopping signal paints a pattern of bright spots at each hop frequency. Intermittent interference appears as faint traces invisible on a single sweep but accumulating visibly over time. Engineers can set the persistence decay from fractions of a second to infinite hold.
The spectrogram, sometimes called a waterfall display, stacks individual spectra vertically over time, with color mapping signal amplitude. Frequency appears on the horizontal axis, time scrolls downward on the vertical, and amplitude is encoded as color. A pulsed signal appears as a series of horizontal dashes. A chirp shows as a slanted line. Frequency drift in an oscillator manifests as a slowly curving trace. The spectrogram is often the first display mode engineers turn to when they need to understand how a signal changes over seconds, minutes, or hours.
The density display shows a statistical histogram of signal amplitude at each frequency point, revealing the probability distribution over the observation period. This is useful for analyzing digitally modulated signals where the peak-to-average power ratio and the distribution of instantaneous power levels matter for linearity and efficiency calculations.
8. Where Real-Time Spectrum Analyzers Are Used
Real-time spectrum analyzers have become essential tools across a range of RF engineering disciplines. In electromagnetic compatibility pre-compliance testing, an RTSA can catch intermittent emissions that a swept analyzer would miss, helping product teams identify and fix EMI problems before formal certification testing. In wireless system integration, RTSAs help engineers verify that Bluetooth, Wi-Fi, cellular, and other radios coexist without mutual interference in dense multi-radio products.
In spectrum management and regulatory monitoring, agencies use RTSAs to detect unauthorized transmissions and monitor spectrum occupancy across wide bands. The ability to capture and record full spectrum for later playback has made the RF recorder functionality particularly valuable in these applications.
In aerospace testing, RTSAs characterize frequency-agile radar systems where signals hop, chirp, and pulse in complex patterns that swept analyzers cannot follow. In manufacturing test, RTSAs speed up production-line RF testing by capturing entire frequency bands in a single acquisition rather than sweeping through each channel sequentially.
Not long ago, a mid-sized telecommunications manufacturer in Eastern Europe approached Dongguan Chenyi Electronics Co Ltd with a persistent problem. Their microwave backhaul radios were failing field tests at roughly 3% of installations, yet every unit passed factory testing. Chenyi Electronics recommended a portable real-time spectrum analyzer for on-site investigation. Within two days, the field team captured a brief 5.8 GHz interference burst occurring only when a nearby airport's weather radar operated in a specific scan mode. The interference lasted roughly 8 milliseconds and repeated every 12 seconds, easily missed by swept instruments. The customer relocated their affected links to alternate frequencies and eliminated the field failures.
In another case, a university RF research group needed to characterize the spectral behavior of a custom frequency-hopping spread-spectrum prototype. Their existing swept analyzer could capture individual hops but provided no visibility into hop timing, sequence patterns, or transition behavior. After acquiring an RTSA through Dongguan Chenyi Electronics, the research team used the spectrogram mode to visualize the complete hop sequence over time, revealing an unintended timing gap between hops that degraded the system's anti-jam performance. The fix was a firmware update that tightened the hop timing by roughly 2.5 microseconds.
9. Factors to Consider When Choosing Your First RTSA
Buying a real-time spectrum analyzer involves trade-offs among frequency range, real-time bandwidth, portability, and budget. A USB-powered RTSA weighing under a kilogram can serve field engineers who need spectrum visibility at cell sites, broadcast towers, and remote installations. The same instrument connected to a laptop makes a capable bench analyzer for a fraction of the cost and size of a rack-mount unit.
For laboratory and production environments where portability is less important, benchtop RTSAs offer larger displays, more front-panel controls, and often wider real-time bandwidths. They also tend to include more built-in measurement applications for specific wireless standards such as LTE, 5G NR, and Wi-Fi, which reduce the setup time for compliance and characterization testing.
The choice of real-time bandwidth should match the widest signal you need to analyze in a single acquisition. For narrowband IoT applications in the sub-GHz ISM bands, 10 MHz to 27 MHz real-time bandwidth is typically sufficient. For Wi-Fi 6 analysis in the 5 GHz band, 40 MHz to 80 MHz is needed to capture full channel bandwidths. For wideband radar pulse analysis or satellite transponder characterization, higher-end instruments become necessary.
Our team at Dongguan Chenyi Electronics regularly helps customers navigate these trade-offs. The conversation usually starts with understanding what kinds of signals the customer needs to capture, in what environment, and at what budget. From there, we can recommend instruments that match the application without overspending on capabilities the customer will never use.
10. Frequently Asked Questions About Real-Time Spectrum Analyzers
10.1 What is the difference between a real-time spectrum analyzer and a vector signal analyzer?
A real-time spectrum analyzer focuses on gap-free spectral visualization across a wide instantaneous bandwidth, with emphasis on detecting transient and frequency-agile signals. A vector signal analyzer, or VSA, focuses on detailed demodulation and modulation-quality analysis of a single signal at a time. Many modern instruments combine both. An RTSA is the right tool when you need to find unknown signals or characterize signal behavior over time. A VSA is the right tool when you know what signal you are looking at and need to measure EVM, constellation errors, or modulation accuracy.
10.2 Can a real-time spectrum analyzer replace a traditional swept analyzer?
For most general-purpose RF measurements, a real-time spectrum analyzer can do everything a swept analyzer can do, and more. Modern RTSAs include swept mode as a fallback for narrow-span measurements where the swept architecture still provides the best dynamic range. However, an RTSA typically costs more than an equivalently ranged swept analyzer, so if your work involves only CW signals, steady-state amplifier testing, or filter alignment, a swept analyzer may offer better value. Chenyi Electronics stocks both types and helps customers assess which category fits their daily workflow.
10.3 Do I need an RTSA if I already own a swept analyzer with FFT mode?
An FFT mode on a swept analyzer provides faster spectrum updates than sweeping alone, but it still processes sequential blocks of spectrum with dead time between acquisitions. It does not provide gap-free processing across the span. If your work involves signals that are always present and slowly changing, a swept analyzer with FFT mode may be sufficient. If you need to find intermittent interference, analyze frequency-hopping signals, or do EMI pre-compliance work, the gap-free processing of a true RTSA is essential.
Recently Posted
-
Understanding Spectrum Analyzer Key Specifications: DANL, Phase Noise, TOI, and RBW
August 14, 20261. The Specification That Cost Two Weeks of DebuggingAn RF design team spent two weeks trying to measure the third harmonic of a 2 Read More
 -
Real-Time Spectrum Analyzer vs Traditional Swept Spectrum Analyzer: Which One Fits Modern RF Testing
August 13, 20261. The Purchase Decision That Engineers Keep Getting WrongA test equipment manager at a contract manufacturer ordered three tradit Read More
 -
Signal Hound SM200B for University RF Laboratory Teaching & Scientific Research
July 20, 2026Signal Hound SM200B for University RF Laboratory Teaching & Scientific ResearchUniversity electronic information, communicatio Read More
 -
Why Signal Hound SM200B is the Best Portable Monitoring Receiver for 5G RF Testing
July 15, 2026Why Signal Hound SM200B is the Best Portable Monitoring Receiver for 5G RF TestingWith the rapid global popularization of 5G commu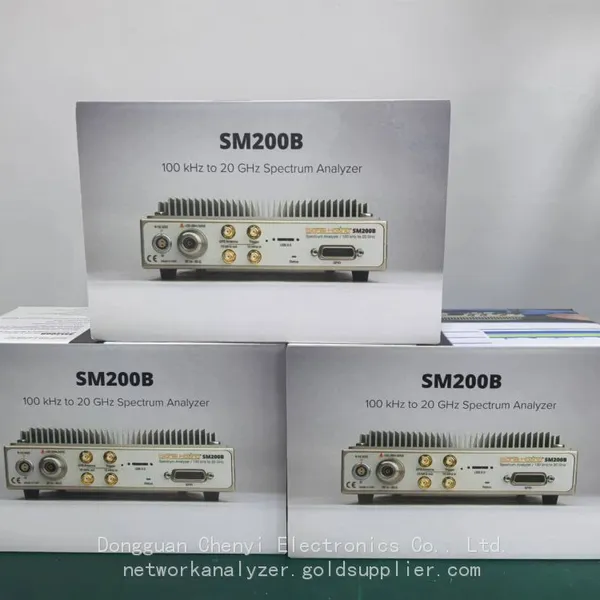 Read More

Contact Us
Recommended Products
-
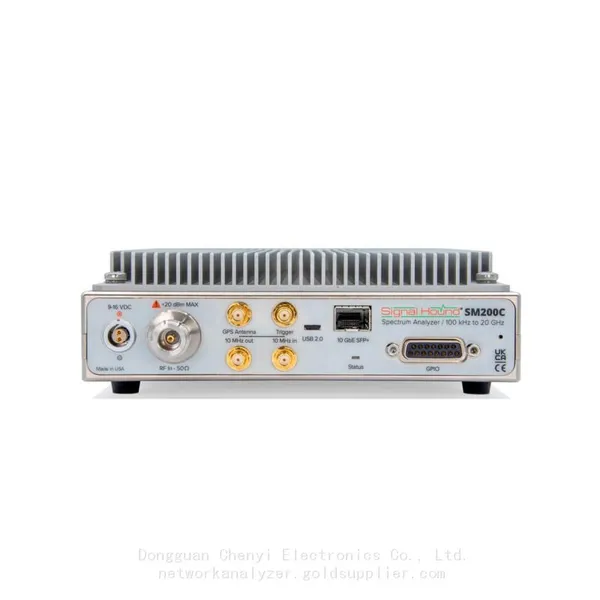
 Signal Hound SM200C 100 KHz to 20 GHz Real-time Spectrum Analyzer With 10GbE Monitoring ReceiversNegotiableMOQ: 1 Unit
 -
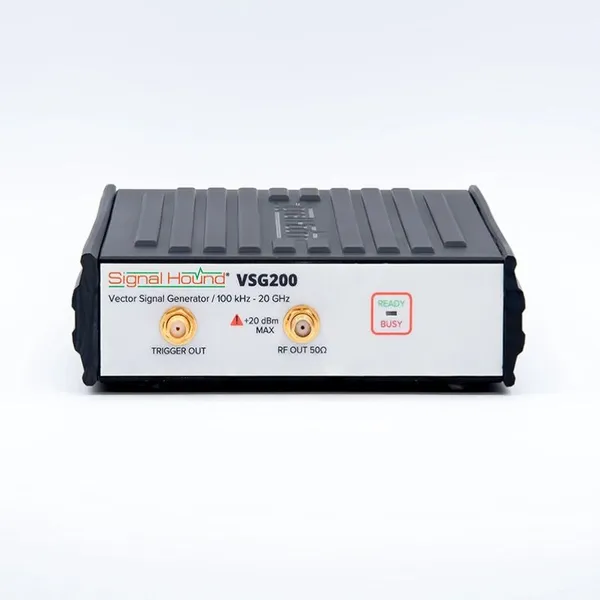
Signal Hound VSG200 Vector Signal Generator 100 KHz to 20 GHzNegotiableMOQ: 1 Unit
-
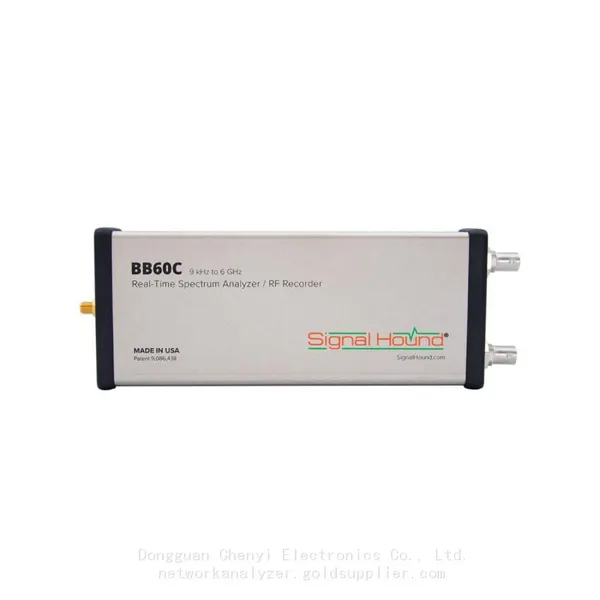
Signal Hound BB60C 9 KHz to 6 GHz Real-time Spectrum AnalyzerNegotiableMOQ: 1 Unit
-
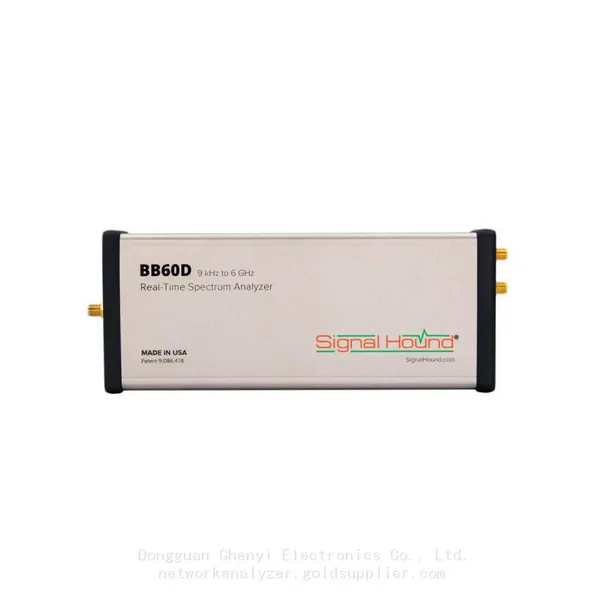
Signal Hound BB60D 9 KHz to 6 GHz Real-time Spectrum AnalyzerNegotiableMOQ: 1 Unit
-
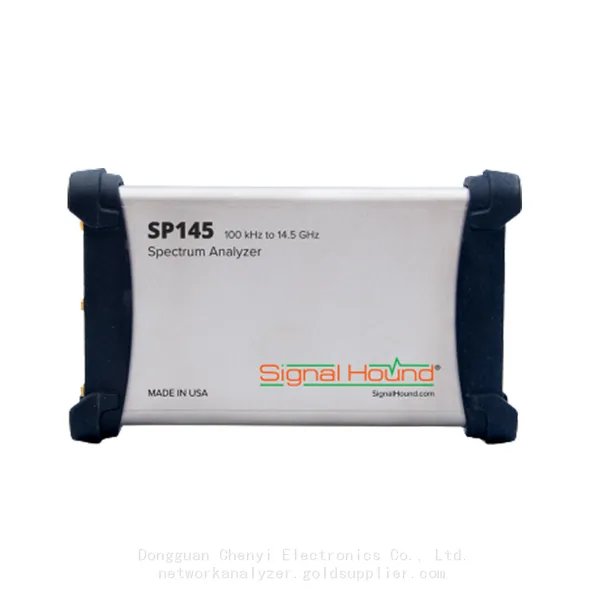
Signal Hound SP145 100 KHz to 14.5 GHz Real-time Spectrum Analyzer Monitoring ReceiversNegotiableMOQ: 1 Unit
-
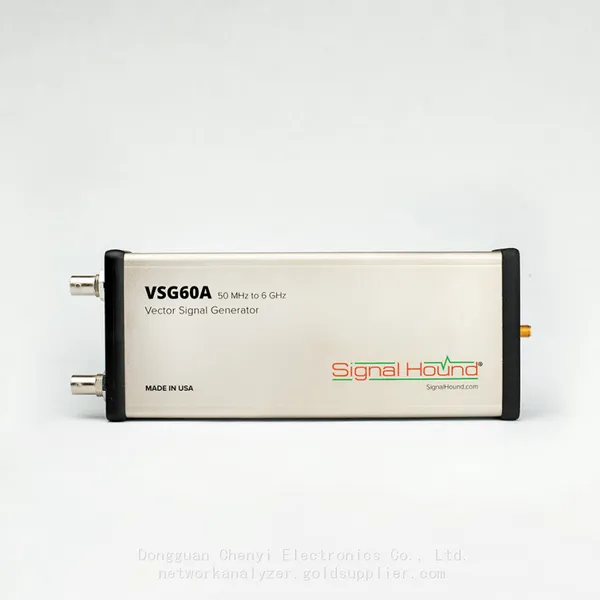
Signal Hound VSG60A 50 MHz to 6 GHz GHz Vector Signal GeneratorNegotiableMOQ: 1 Unit
-
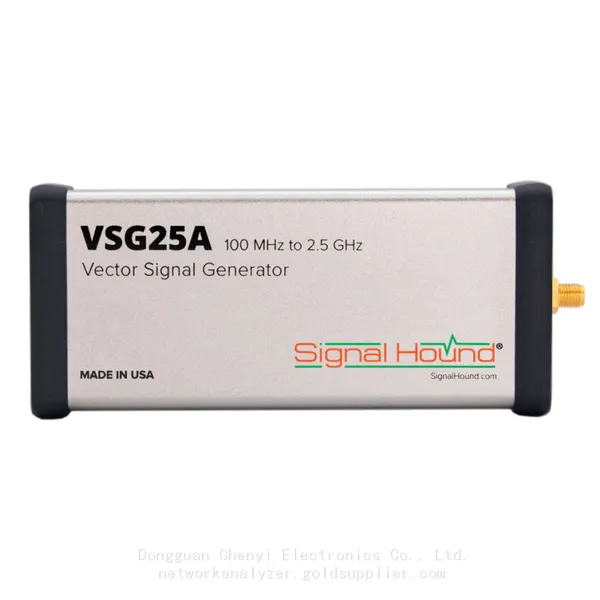
Signal Hound VSG25A 100 MHz to 2.5 GHz Vector Signal GeneratorNegotiableMOQ: 1 Unit
-
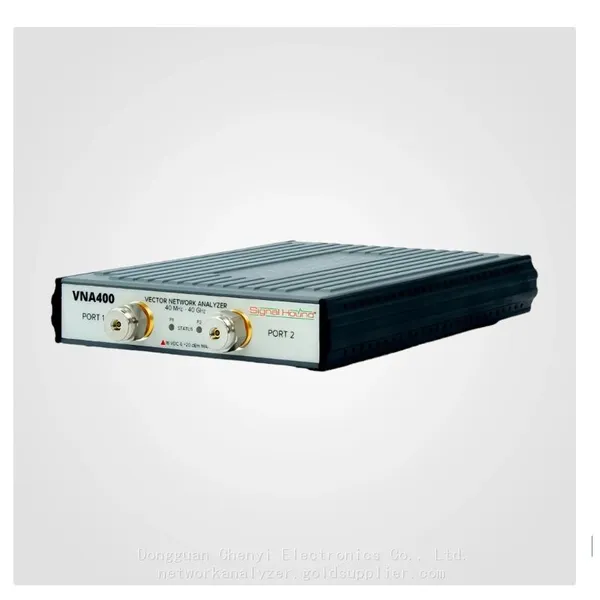
Signal Hound VNA400 40 MHz to 40 GHz 2-port Vector Network AnalyzerNegotiableMOQ: 1 Unit
-
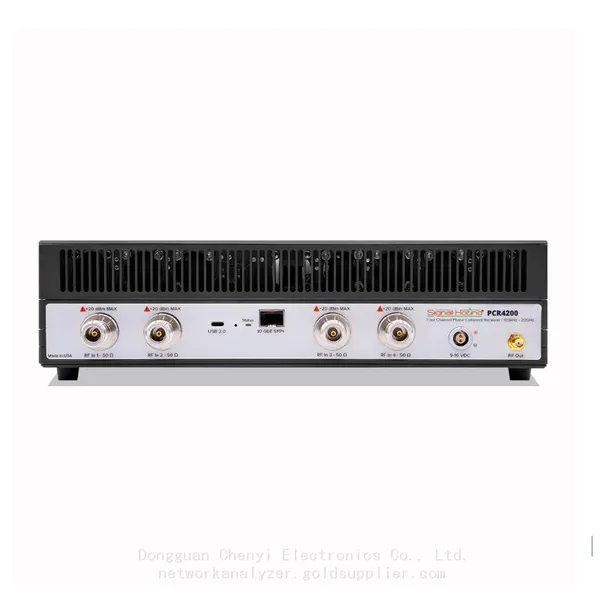
Signal Hound PCR4200 100 KHz to 20 GHz Four-Channel Phase Coherent ReceiverNegotiableMOQ: 1 Unit
-
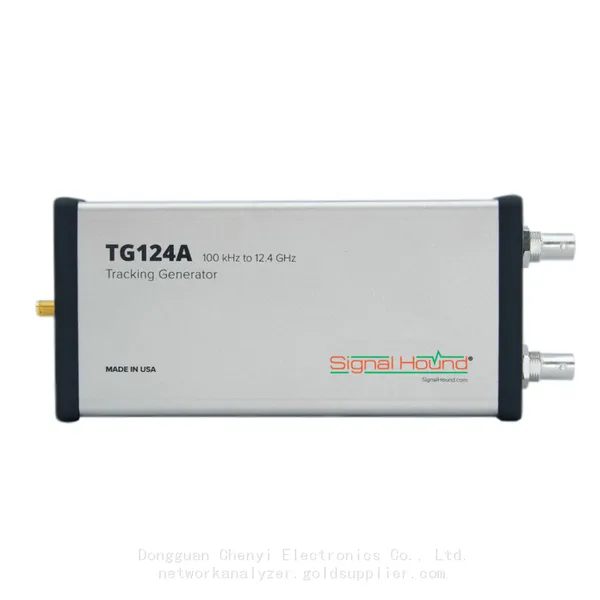
Signal Hound TG124A 100 KHz to 12.4 GHz Tracking GeneratorNegotiableMOQ: 1 Unit
-
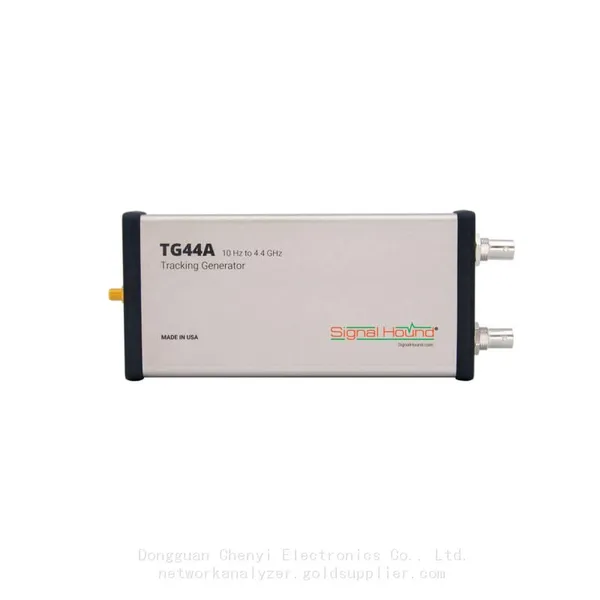
Signal Hound TG44A 10 Hz to 4.4 GHz t Tracking GeneratorNegotiableMOQ: 1 Unit
-
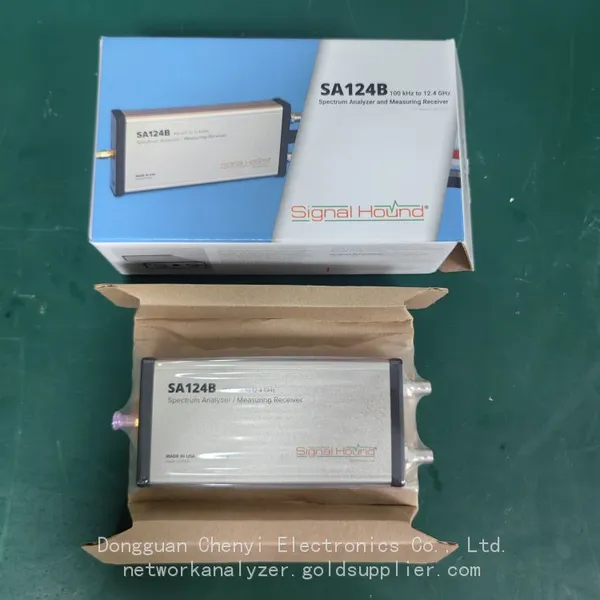
Signal Hound SA124B 100 KHz to 12.4 GHz Spectrum AnalyzerNegotiableMOQ: 1 Unit
-
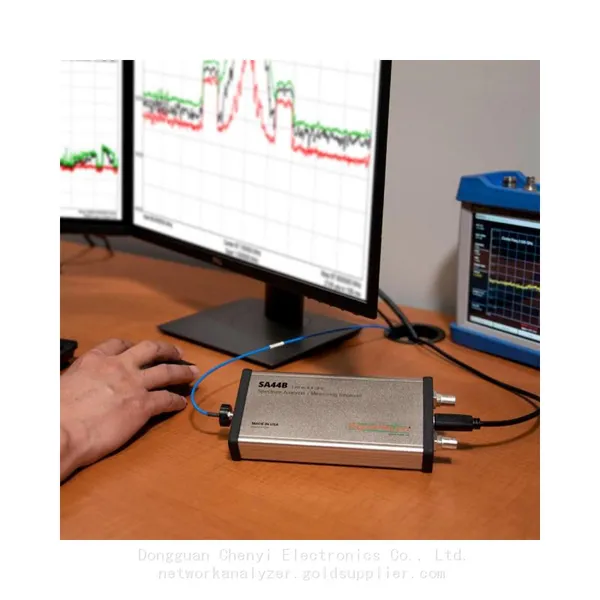
Signal Hound SA44B 1 Hz to 4.4 GHz Spectrum AnalyzerNegotiableMOQ: 1 Unit
-
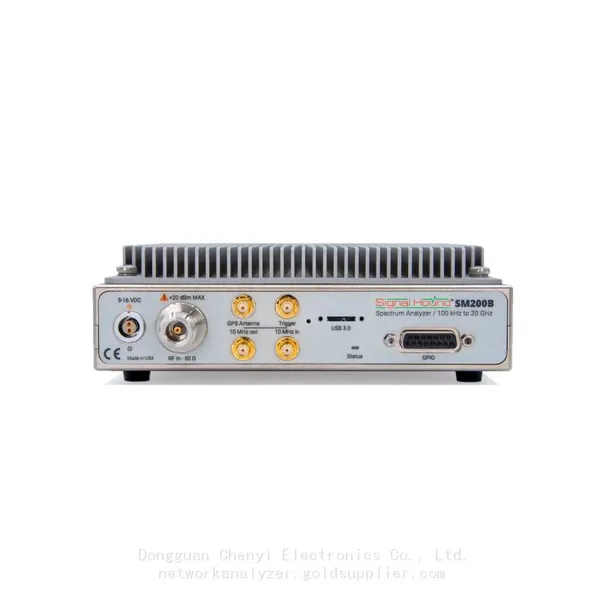
Signal Hound SM200B 100 KHz to 20 GHz Real-time Spectrum Analyzer Monitoring ReceiversNegotiableMOQ: 1 Unit
-
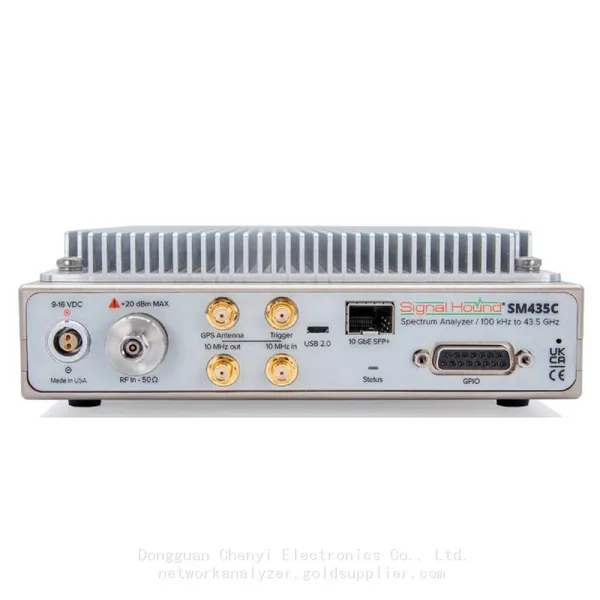
Signal Hound SM435C 100 KHz to 43.5GHz Real-time Spectrum Analyzer With 10GbE Monitoring ReceiversNegotiableMOQ: 1 Unit
-
Signal Hound SM435B 100 KHz to 43.5GHz Real-time Spectrum Analyzer Monitoring ReceiversNegotiableMOQ: 1 Unit
-
Signal Hound PN400 Phase Noise and VCO Test System 100 KHz to 43.5 GHzNegotiableMOQ: 1 Unit
-
Keysight E4980A Precision LCR Meter 20 Hz to 2 MHzNegotiableMOQ: 1 Unit
-
Keysight E4980B and E4980BL Precision LCR Meter 20 Hz to 2 MHzNegotiableMOQ: 1 Unit
-
Keysight U1733C Handheld LCR Meter 100Hz 120Hz 1kHz 10kHz 100kHzNegotiableMOQ: 1 Unit