
Signal Hound Spike RF Heatmap Analysis Mode: Empowering Precision in Radio Frequency Monitoring
Signal Hound Spike RF Heatmap Analysis Mode: Empowering Precision in Radio Frequency Monitoring
In the dynamic landscape of radio frequency (RF) engineering, the ability to visualize, analyze, and interpret complex RF signals is critical for ensuring the performance, reliability, and security of communication systems. From telecommunications and aerospace to defense and industrial automation, RF environments are increasingly crowded and complex, characterized by overlapping signals, intermittent interference, and subtle signal anomalies. To address these challenges, Signal Hound— a renowned innovator in RF test and measurement solutions—has integrated a powerful Heatmap Analysis Mode into its Spike software, revolutionizing how engineers and technicians monitor and analyze RF spectra. This advanced feature transforms raw RF data into intuitive, color-coded visualizations, enabling rapid detection of signal patterns, interference sources, and performance bottlenecks that might go unnoticed with traditional spectrum analysis tools.
Signal Hound’s Spike software is widely recognized for its user-friendly interface, real-time data processing capabilities, and seamless integration with the company’s portfolio of RF receivers and spectrum analyzers. The Heatmap Analysis Mode builds on this foundation by leveraging sophisticated data visualization techniques to represent three key dimensions of RF data: frequency, time, and signal amplitude (or power). Unlike conventional 2D spectrum displays that only show frequency vs. amplitude, the heatmap mode adds a temporal dimension, creating a dynamic “time-frequency” visualization where color intensity corresponds to signal power. This multi-dimensional approach allows users to track how RF signals evolve over time, identify transient interference, and correlate signal activities with specific events or operational changes.
At the core of the Spike Heatmap Analysis Mode is its ability to simplify complex RF data interpretation through intuitive color coding. Typically, cooler colors (such as blue or green) represent lower signal power levels, while warmer colors (such as yellow, orange, or red) indicate higher power signals or areas of concentrated RF activity. This visual hierarchy enables even non-expert users to quickly identify “hotspots”—regions of the frequency spectrum where signal power is abnormally high, often indicating interference, signal leakage, or unintended emissions. For example, in a cellular communication network, a sudden red hotspot in the heatmap could alert engineers to a nearby jamming device or a faulty transmitter causing harmful interference to adjacent frequency bands.
One of the key technical advantages of the Spike Heatmap Analysis Mode is its flexibility and customization capabilities. Users can adjust critical parameters such as frequency range, time scale, and power threshold to tailor the visualization to their specific application needs. For instance, in long-term monitoring scenarios (such as 24/7 network surveillance), users can extend the time scale to hours or days, allowing them to observe long-term signal trends and periodic interference patterns. In contrast, for troubleshooting transient issues (such as intermittent signal drops), a shorter time scale with high temporal resolution can capture fleeting signal anomalies that might be missed by slower sampling tools. Additionally, the software allows users to overlay markers, annotations, and reference lines on the heatmap, facilitating documentation and collaboration among team members.
The practical applications of Signal Hound’s Spike Heatmap Analysis Mode span across multiple industries, addressing diverse RF monitoring challenges. In the telecommunications sector, it is invaluable for 5G network deployment and optimization. As 5G networks operate in higher frequency bands (such as mmWave) with narrower bandwidths, they are more susceptible to interference and signal propagation issues. The heatmap mode enables engineers to visualize how 5G signals propagate in urban environments, identify areas with poor signal coverage, and detect interference from other wireless systems (such as Wi-Fi or Bluetooth). This information is critical for optimizing network coverage, improving signal quality, and ensuring a seamless user experience.
In the defense and aerospace industries, the Spike Heatmap Analysis Mode plays a vital role in RF signal intelligence (SIGINT) and electronic warfare (EW) applications. Military and aerospace engineers use the heatmap mode to monitor and analyze enemy RF emissions, identify the location and type of hostile transmitters, and detect jamming attempts. The real-time, color-coded visualization allows for rapid decision-making in high-pressure environments, enabling defense systems to respond quickly to emerging threats. Additionally, the heatmap mode is used to test and validate the performance of radar systems, satellite communication links, and other critical aerospace RF systems, ensuring they can operate reliably in harsh and contested RF environments.
Industrial automation is another key area where the Spike Heatmap Analysis Mode delivers significant value. Modern industrial facilities rely heavily on wireless communication systems (such as Industrial IoT, Wi-Fi 6, and LoRa) to connect sensors, controllers, and actuators. However, industrial environments are often plagued by RF interference from machinery, electrical equipment, and other industrial devices. The heatmap mode helps industrial engineers identify sources of interference, assess their impact on wireless communication systems, and implement mitigation strategies. For example, a heatmap might reveal that a nearby motor is emitting interference in the same frequency band as a wireless sensor network, causing data loss. Armed with this information, engineers can reconfigure the sensor network to operate on a different frequency or install shielding around the interfering motor.
Beyond its core visualization capabilities, the Spike Heatmap Analysis Mode integrates seamlessly with other advanced features of the Spike software, enhancing its overall utility. For instance, users can trigger recordings based on specific heatmap events (such as the appearance of a red hotspot), allowing for automated data collection and analysis. The software also supports data export in various formats (such as CSV or PNG), enabling further analysis in third-party tools or integration into reports and presentations. Additionally, Signal Hound’s commitment to continuous software updates ensures that the Heatmap Analysis Mode remains at the cutting edge of RF visualization technology, with new features and improvements regularly added based on user feedback and industry trends.
As RF environments continue to grow in complexity and density, the need for advanced visualization and analysis tools becomes increasingly critical. Signal Hound’s Spike RF Heatmap Analysis Mode addresses this need by transforming abstract RF data into actionable insights, empowering engineers and technicians to make faster, more informed decisions. Whether it’s optimizing telecommunications networks, enhancing defense systems, or ensuring reliable industrial automation, the heatmap mode delivers the precision and visibility required to navigate the challenges of modern RF environments.
In conclusion, Signal Hound’s Spike RF Heatmap Analysis Mode represents a significant advancement in RF test and measurement technology. Its intuitive, multi-dimensional visualization capabilities simplify complex RF data interpretation, enabling rapid detection of signals, interference, and anomalies. With its flexibility, customization options, and wide-ranging industry applications, the heatmap mode has become an indispensable tool for RF professionals worldwide. As Signal Hound continues to innovate and refine its Spike software, the Heatmap Analysis Mode will undoubtedly remain a cornerstone of precision RF monitoring, supporting the development and maintenance of robust, reliable communication systems in an increasingly connected world.


Recently Posted
-
Cost-Benefit Analysis: Why Choose Signal Hound BB60D for RF Testing Projects
July 2, 2026Cost-Benefit Analysis: Why Choose Signal Hound BB60D for RF Testing ProjectsIn enterprise RF testing projects, laboratory scientif Read More
 -
Ultimate Buying Guide for Signal Hound BB60D Real-Time Spectrum Analyzer: Features, Uses & Benefits
July 2, 2026Ultimate Buying Guide for Signal Hound BB60D Real-Time Spectrum Analyzer: Features, Uses & BenefitsFor RF engineers, laborator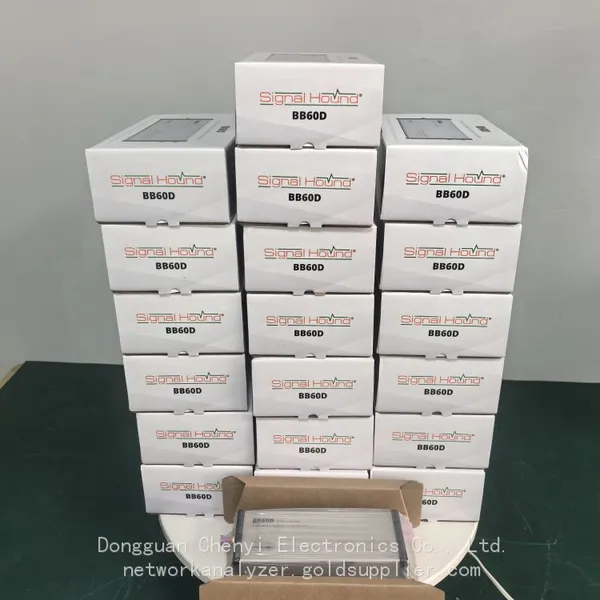 Read More
 -
Common Application Scenarios & User Cases of Signal Hound BB60D Spectrum Analyzer
July 2, 2026Common Application Scenarios & User Cases of Signal Hound BB60D Spectrum AnalyzerThe Signal Hound BB60D real-time spectrum ana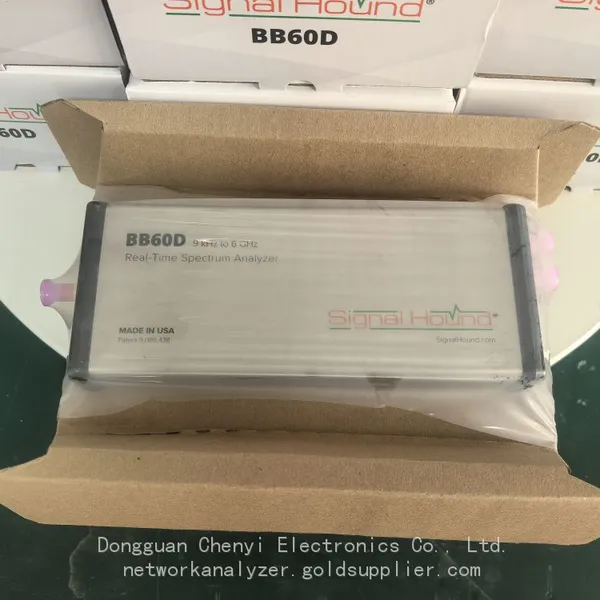 Read More
 -
Signal Hound BB60D for Radar Signal Analysis & Pulse Signal Testing
July 2, 2026Signal Hound BB60D for Radar Signal Analysis & Pulse Signal TestingRadar signal analysis and pulse signal testing are high-pre
Read More

Contact Us
Recommended Products
-
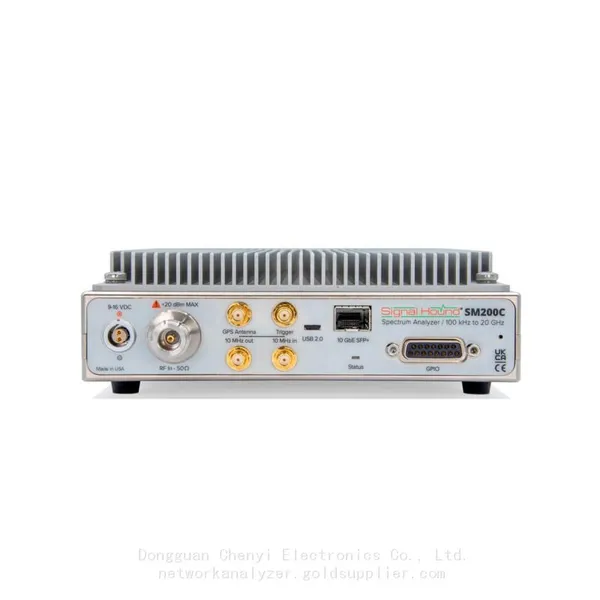
 Signal Hound SM200C 100 KHz to 20 GHz Real-time Spectrum Analyzer With 10GbE Monitoring ReceiversNegotiableMOQ: 1 Unit
 -
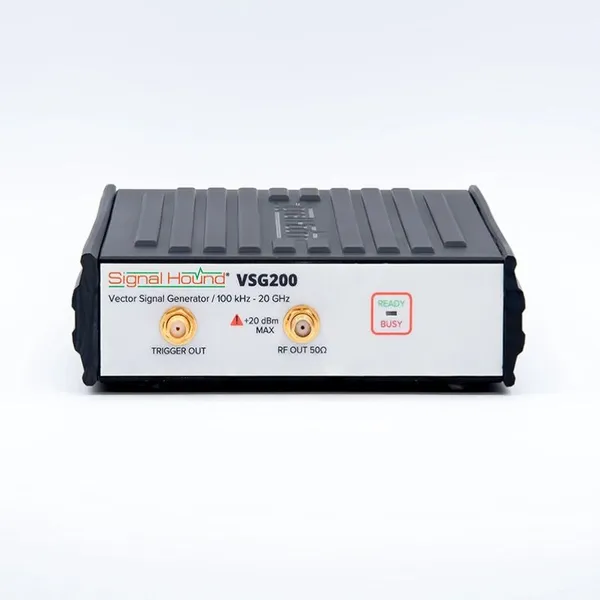
Signal Hound VSG200 Vector Signal Generator 100 KHz to 20 GHzNegotiableMOQ: 1 Unit
-
Signal Hound BB60C 9 KHz to 6 GHz Real-time Spectrum AnalyzerNegotiableMOQ: 1 Unit
-
Signal Hound BB60D 9 KHz to 6 GHz Real-time Spectrum AnalyzerNegotiableMOQ: 1 Unit
-
Signal Hound SP145 100 KHz to 14.5 GHz Real-time Spectrum Analyzer Monitoring ReceiversNegotiableMOQ: 1 Unit
-
Signal Hound VSG60A 50 MHz to 6 GHz GHz Vector Signal GeneratorNegotiableMOQ: 1 Unit
-
Signal Hound VSG25A 100 MHz to 2.5 GHz Vector Signal GeneratorNegotiableMOQ: 1 Unit
-
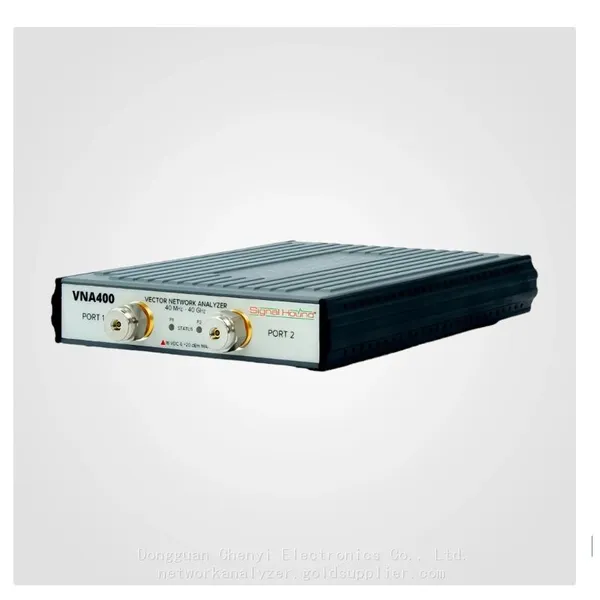
Signal Hound VNA400 40 MHz to 40 GHz 2-port Vector Network AnalyzerNegotiableMOQ: 1 Unit
-
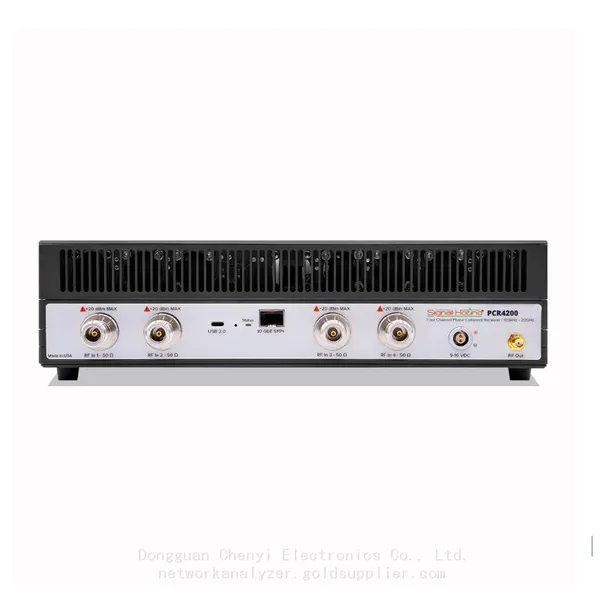
Signal Hound PCR4200 100 KHz to 20 GHz Four-Channel Phase Coherent ReceiverNegotiableMOQ: 1 Unit
-
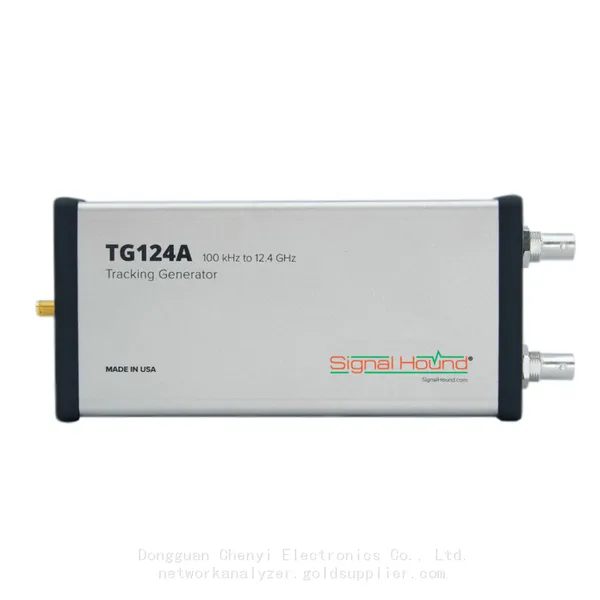
Signal Hound TG124A 100 KHz to 12.4 GHz Tracking GeneratorNegotiableMOQ: 1 Unit
-
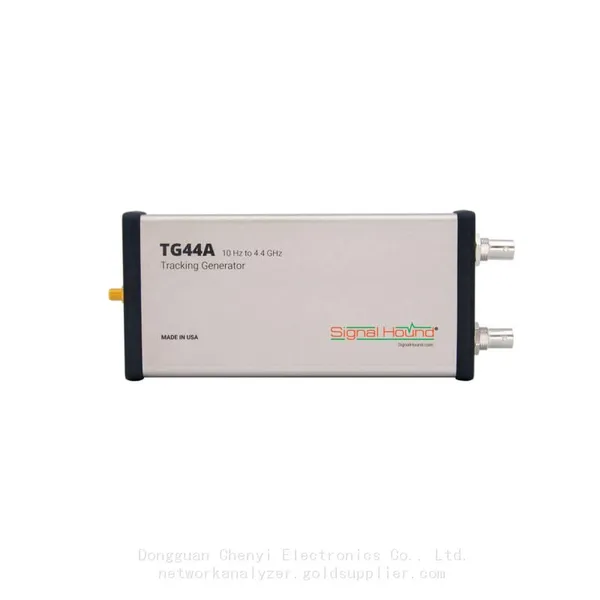
Signal Hound TG44A 10 Hz to 4.4 GHz t Tracking GeneratorNegotiableMOQ: 1 Unit
-
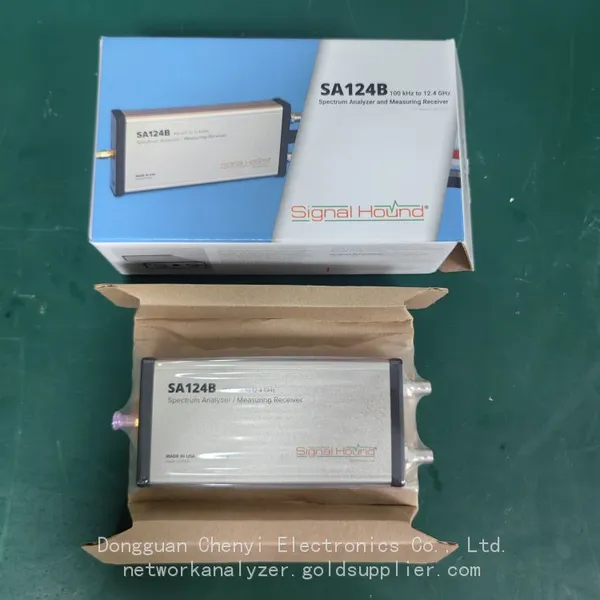
Signal Hound SA124B 100 KHz to 12.4 GHz Spectrum AnalyzerNegotiableMOQ: 1 Unit
-
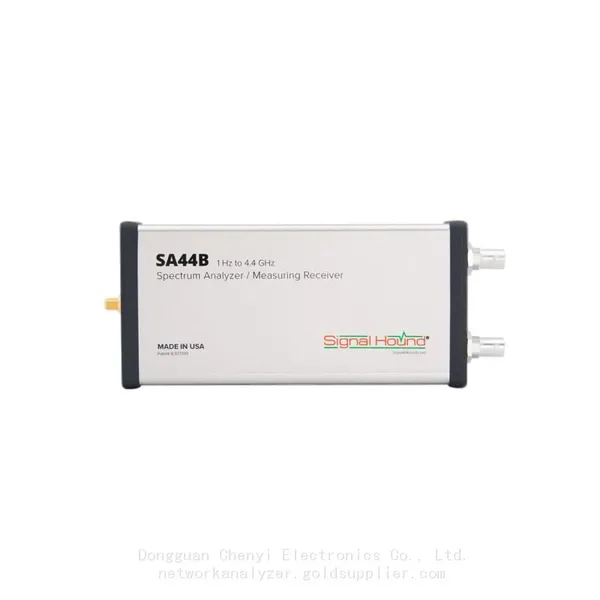
Signal Hound SA44B 1 Hz to 4.4 GHz Spectrum AnalyzerNegotiableMOQ: 1 Unit
-
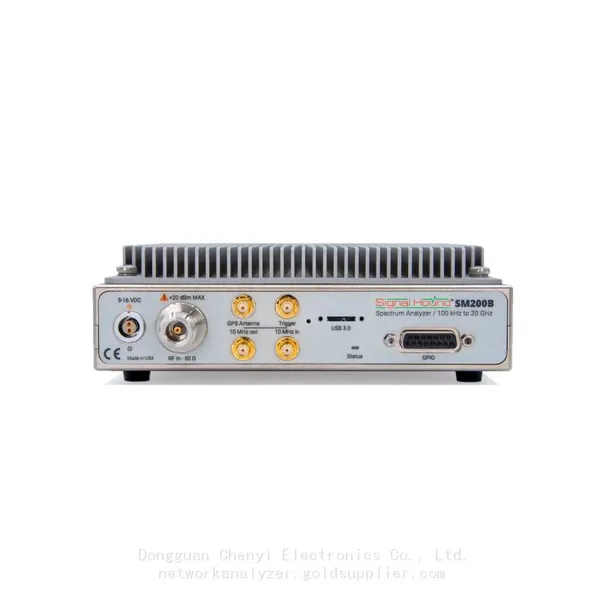
Signal Hound SM200B 100 KHz to 20 GHz Real-time Spectrum Analyzer Monitoring ReceiversNegotiableMOQ: 1 Unit
-
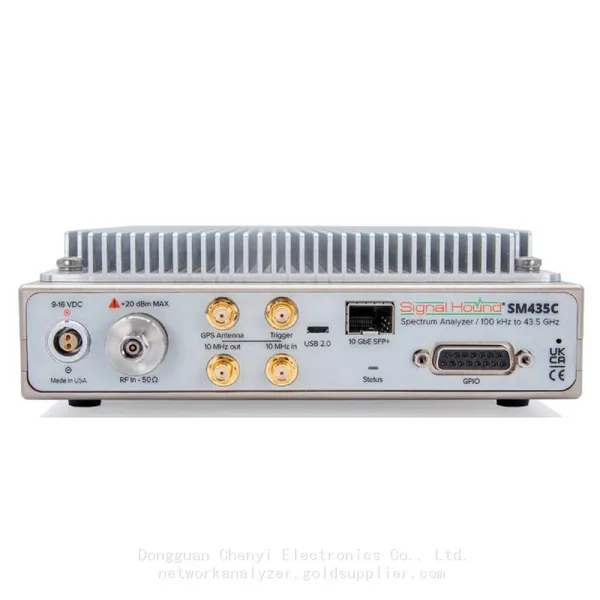
Signal Hound SM435C 100 KHz to 43.5GHz Real-time Spectrum Analyzer With 10GbE Monitoring ReceiversNegotiableMOQ: 1 Unit
-
Signal Hound SM435B 100 KHz to 43.5GHz Real-time Spectrum Analyzer Monitoring ReceiversNegotiableMOQ: 1 Unit
-
Signal Hound PN400 Phase Noise and VCO Test System 100 KHz to 43.5 GHzNegotiableMOQ: 1 Unit
-
Keysight E4980A Precision LCR Meter 20 Hz to 2 MHzNegotiableMOQ: 1 Unit
-
Keysight E4980B and E4980BL Precision LCR Meter 20 Hz to 2 MHzNegotiableMOQ: 1 Unit
-
Keysight U1733C Handheld LCR Meter 100Hz 120Hz 1kHz 10kHz 100kHzNegotiableMOQ: 1 Unit