
10 Common Problems in the Use of Network Spectrum Analyzers
10 Common Problems in the Use of Network Spectrum Analyzers
Network spectrum analyzers are core equipment for radio frequency testing. Measurement anomalies often occur due to operational errors, improper parameter settings, or environmental interference. The following summarizes 10 frequent problems and corresponding solutions covering operation, parameters, hardware, environment and other aspects, helping you quickly troubleshoot issues and ensure measurement accuracy.
1. No Signal Display or Abnormal Amplitude
Common Phenomena
No signal trace on the screen, amplitude far lower than expected, or obvious distortion.
Main Causes
Loose RF connection, damaged cables or mismatched interfaces (e.g., mixed use of SMA/N-type connectors);
Incorrect frequency range settings, not covering the measured signal band;
The device under test is not powered on or the signal source has no output;
Input signal overload triggering internal protection, resulting in signal suppression.
Solutions
Check the RF link to ensure connectors are tightened, cables are free of bending or damage, and interface models are matched;
Reset the frequency range or search for signals in "full sweep" mode;
Confirm that the device under test and signal source are properly powered on with normal output;
If overload is suspected, connect a 10–30 dB attenuator in series to reduce input power, then adjust the reference level.
2. Input Overload Alarm
Common Phenomena
An overload prompt pops up on the screen, the trace is top-clipped and distorted, and measurement data is severely inaccurate.
Main Causes
The input signal power exceeds the instrument’s maximum withstand value (usually +30 dBm), causing the front-end mixer and amplifier to enter a nonlinear state.
Solutions
Disconnect the signal first and measure the actual signal power with a power meter;
Connect an appropriate attenuator (e.g., 20–30 dB) in series to reduce input power to a safe range;
Manually increase the instrument’s "input attenuation" parameter (adjustable from 0 to 60 dB) to improve overload resistance;
Avoid direct connection to high-power RF sources such as base stations.
3. Obvious Frequency Reading Drift and Jitter
Common Phenomena
The measured signal frequency shifts continuously or jitters frequently within a small range without a fixed value.
Main Causes
Insufficient warm-up time after power-on, unstable local oscillator (LO) which is highly temperature-sensitive;
Excessive ambient temperature fluctuation (beyond ±5℃) leading to local oscillator frequency drift;
Uncalibrated frequency reference with long-term drift exceeding ±1 ppm;
Poor interface contact or clock module failure.
Solutions
Warm up the instrument for at least 30 minutes after power-on; some models prompt when warm-up is complete before testing;
Maintain a constant test environment or enable the instrument’s "temperature compensation" function;
Perform built-in frequency calibration (Frequency Cal) after ensuring a stable environment;
If drift persists, check for oxidized interfaces and contact maintenance for clock module inspection if necessary.
4. Excessively High Noise Floor
Common Phenomena
Elevated background baseline, weak signals submerged by noise, and inability to accurately identify small-signal amplitudes.
Main Causes
Overly narrow resolution bandwidth (RBW) leading to long sweep time and accumulated noise;
Dirty or oxidized connectors and cables introducing additional contact noise;
Preamp not enabled or unreasonable gain settings after enabling;
Ambient electromagnetic interference (e.g., from nearby inverters, high-voltage lines, mobile signals).
Solutions
Widen RBW appropriately (e.g., from 1 kHz to 10 kHz) to balance sensitivity and sweep speed;
Clean RF interfaces and cable connectors with anhydrous ethanol to remove oxide layers and stains;
Enable the preamp reasonably (usually 10–20 dB gain) to avoid self-oscillation from excessive gain;
Stay away from strong interference sources; use shielding boxes or EMI filters if necessary.
5. Misunderstandings in Setting Resolution Bandwidth (RBW) and Video Bandwidth (VBW)
Common Phenomena
Blurred spectrograms, inability to distinguish adjacent signals, or excessively slow scanning; sine signal amplitude varies with VBW, and pulse signals display unstably.
Main Causes
Confusion between RBW and VBW functions: RBW determines frequency resolution (by IF filters), while VBW only smoothens the display and filters noise without changing the actual signal amplitude;
Overly narrow RBW (pursuing high resolution) causing a sharp increase in sweep time, or overly wide RBW leading to overlapping adjacent signals;
Unreasonable VBW settings (too large to smooth noise, too small causing pulse signal distortion).
Solutions
Clarify functional boundaries: RBW distinguishes adjacent signals, VBW smoothens display, and sine signal amplitude is independent of VBW;
Scanning strategy: first use a wide RBW to quickly locate signals, then a narrow RBW (e.g., 1 kHz) for precise resolution measurement;
Recommended VBW setting: VBW = 0.1–1×RBW, balancing smoothness and response speed;
For pulse signal testing, widen VBW appropriately to avoid signal distortion.
6. Calibration Failure or Insufficient Accuracy After Calibration
Common Phenomena
Errors occur during calibration (CAL), or measurement results deviate greatly from standard values after calibration.
Main Causes
Mismatched calibration kit models (e.g., incompatible frequency bands or interfaces) or damaged calibration kits;
Omitted calibration steps (e.g., incomplete SOLT/TRL process) without port extension compensation;
Large changes in ambient temperature and humidity during calibration (recommended 23±5℃, humidity<80%);
Long-term lack of professional calibration leading to internal reference drift.
Solutions
Use calibration kits fully matching the instrument’s frequency band and interface, and regularly inspect for damage;
Strictly follow the complete calibration process including port extension compensation, and verify indicators (e.g., Directivity >35 dB) after calibration;
Stabilize ambient temperature and humidity before calibration to avoid rapid changes affecting accuracy;
Send the instrument for comprehensive professional calibration annually to ensure long-term accuracy.
7. Abnormal Scanning and Unstable Traces
Common Phenomena
Interrupted scanning, severe trace jitter, or failure to complete full-band scanning.
Main Causes
Outdated firmware or failed self-calibration, conflicting software configurations;
Faults in RF modules or step attenuators (e.g., oxidized contacts, aged components);
Unstable power supply causing abnormal instrument operation;
Excessive background functions enabled (e.g., real-time analysis, data logging) occupying system resources.
Solutions
Upgrade instrument firmware to the latest version and perform built-in self-calibration (Self-Cal);
Inspect the RF link; if attenuator contacts are oxidized, contact professionals for cleaning or replacement;
Use a stable power supply with proper grounding to avoid grid fluctuation interference;
Disable unnecessary background functions and simplify test configurations to reduce resource usage.
8. Misjudging Spurious Signals as Measured Signals
Common Phenomena
Extra signal spikes appear in the spectrogram, misjudged as target signals, leading to measurement errors.
Main Causes
Spurious signals generated by the instrument itself (e.g., local oscillator harmonics, mixer intermodulation);
External environmental interference (e.g., radiation from mobile phones, WiFi, inverters);
Harmonics and intermodulation signals of the device under test, or reflected signals in the test link.
Solutions
Spurious identification: disconnect the device under test and run the instrument alone; if spurs remain, they originate from the instrument;
External interference troubleshooting: change the test location or isolate the instrument with a shielding cover to check if spurs disappear;
Parameter optimization: adjust RBW, reference level, or switch detection mode (e.g., Peak detection) to distinguish spurs from real signals;
Test link optimization: reduce cascaded devices, use high-quality cables and connectors to lower reflection interference.
9. Data Storage Failure or Data Loss
Common Phenomena
Inability to save test data, corrupted files, or errors when reading historical data.
Main Causes
Incompatible storage medium (USB drive, hard disk) format (e.g., NTFS not supported by old models);
Insufficient storage space or low-quality storage media (e.g., faulty cheap USB drives);
Software anomalies or storage module failures.
Solutions
Format storage media to FAT32 supported by the instrument, avoiding NTFS/EXT formats;
Regularly clean instrument storage, delete useless test data, and reserve sufficient space;
Use industrial-grade USB drives or hard disks to avoid data corruption from low-quality media;
Restart the instrument or update software; if problems persist, contact maintenance for storage module inspection.
10. Measurement Errors Caused by Impedance Mismatch
Common Phenomena
Large measurement deviations, abnormal reflection coefficient (S11), and obvious signal amplitude fluctuations.
Main Causes
Mismatch between instrument input impedance and measured system impedance (instrument defaults to 50Ω, 75Ω required in some scenarios);
Inconsistent characteristic impedance of RF cables and connectors, or deformed interfaces with poor contact;
Non-standard port impedance of the device under test (e.g., non-50Ω/75Ω) without impedance conversion.
Solutions
Clarify impedance requirements: 50Ω default for RF testing, 75Ω for CATV and other scenarios, matching instrument impedance in advance;
Check the link: use RF cables and connectors matching the instrument’s impedance, avoiding deformed or oxidized interfaces;
Special scenario adaptation: use impedance converters (e.g., 50Ω to 75Ω) if the device under test has non-standard impedance;
Calibration compensation: compensate link impedance errors with calibration kits to improve measurement accuracy.
Recently Posted
-
Cost-Benefit Analysis: Why Choose Signal Hound BB60D for RF Testing Projects
July 2, 2026Cost-Benefit Analysis: Why Choose Signal Hound BB60D for RF Testing ProjectsIn enterprise RF testing projects, laboratory scientif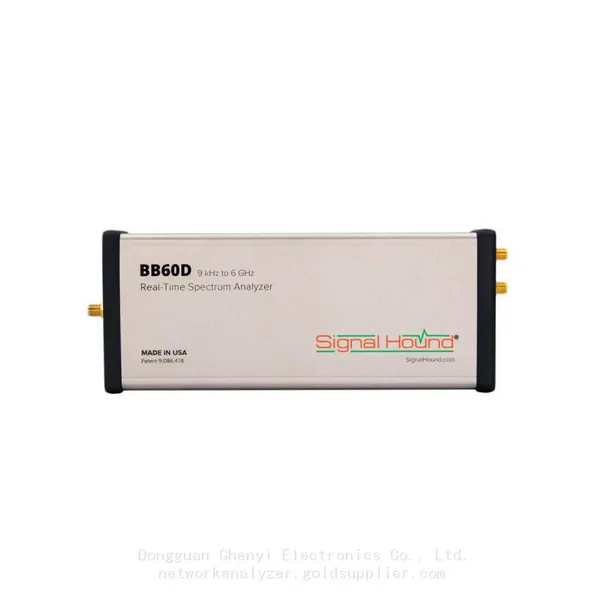 Read More
 -
Ultimate Buying Guide for Signal Hound BB60D Real-Time Spectrum Analyzer: Features, Uses & Benefits
July 2, 2026Ultimate Buying Guide for Signal Hound BB60D Real-Time Spectrum Analyzer: Features, Uses & BenefitsFor RF engineers, laborator Read More
 -
Common Application Scenarios & User Cases of Signal Hound BB60D Spectrum Analyzer
July 2, 2026Common Application Scenarios & User Cases of Signal Hound BB60D Spectrum AnalyzerThe Signal Hound BB60D real-time spectrum ana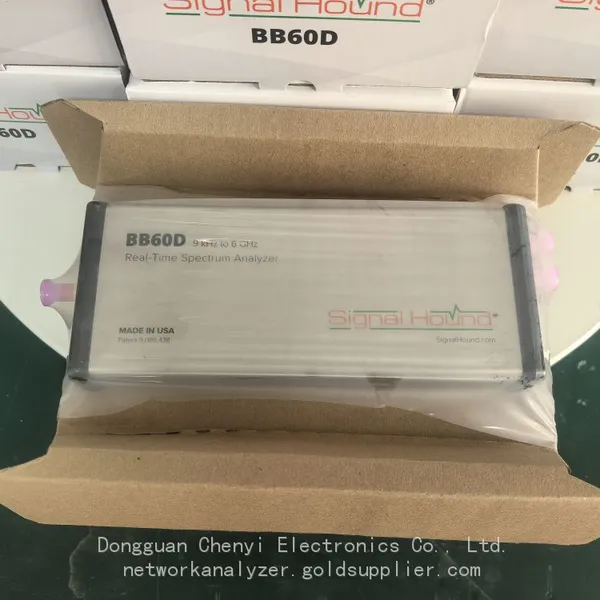 Read More
 -
Signal Hound BB60D for Radar Signal Analysis & Pulse Signal Testing
July 2, 2026Signal Hound BB60D for Radar Signal Analysis & Pulse Signal TestingRadar signal analysis and pulse signal testing are high-pre
Read More

Contact Us
Recommended Products
-
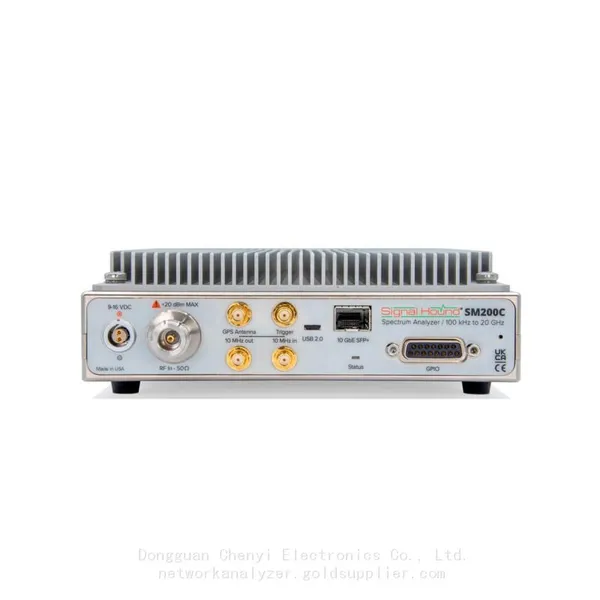
 Signal Hound SM200C 100 KHz to 20 GHz Real-time Spectrum Analyzer With 10GbE Monitoring ReceiversNegotiableMOQ: 1 Unit
 -
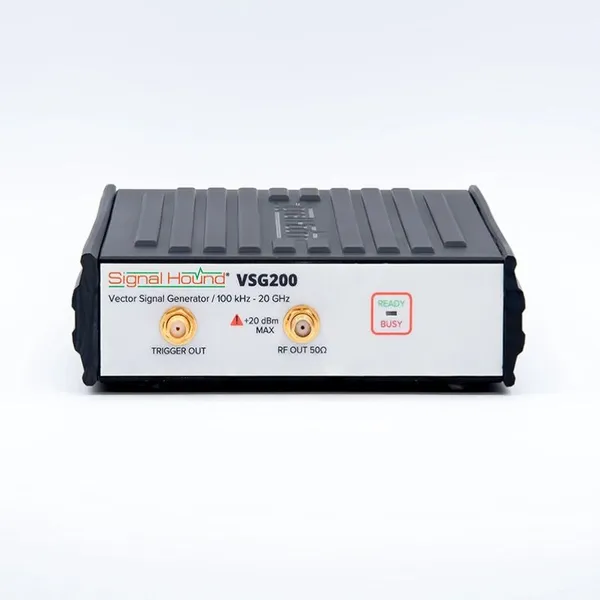
Signal Hound VSG200 Vector Signal Generator 100 KHz to 20 GHzNegotiableMOQ: 1 Unit
-
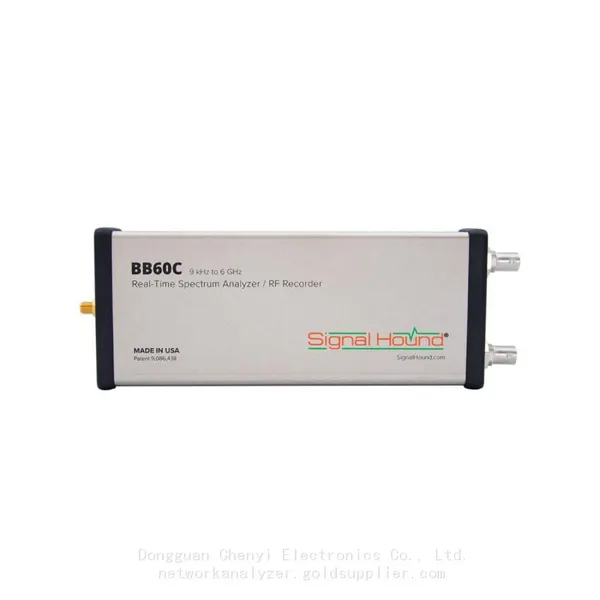
Signal Hound BB60C 9 KHz to 6 GHz Real-time Spectrum AnalyzerNegotiableMOQ: 1 Unit
-
Signal Hound BB60D 9 KHz to 6 GHz Real-time Spectrum AnalyzerNegotiableMOQ: 1 Unit
-
Signal Hound SP145 100 KHz to 14.5 GHz Real-time Spectrum Analyzer Monitoring ReceiversNegotiableMOQ: 1 Unit
-
Signal Hound VSG60A 50 MHz to 6 GHz GHz Vector Signal GeneratorNegotiableMOQ: 1 Unit
-
Signal Hound VSG25A 100 MHz to 2.5 GHz Vector Signal GeneratorNegotiableMOQ: 1 Unit
-
Signal Hound VNA400 40 MHz to 40 GHz 2-port Vector Network AnalyzerNegotiableMOQ: 1 Unit
-
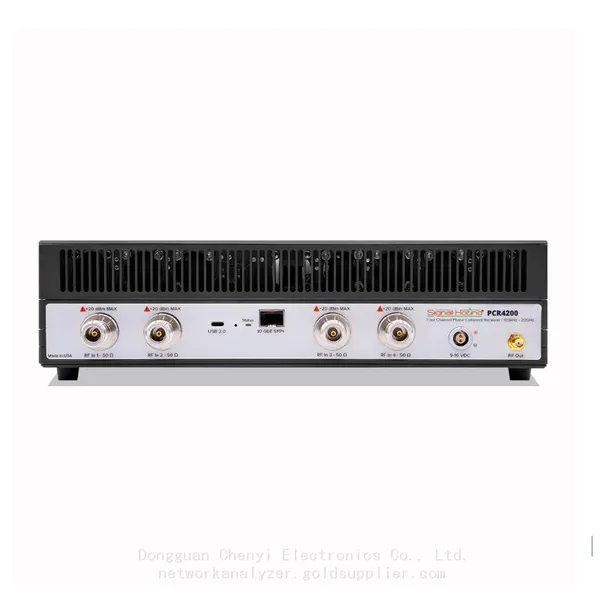
Signal Hound PCR4200 100 KHz to 20 GHz Four-Channel Phase Coherent ReceiverNegotiableMOQ: 1 Unit
-
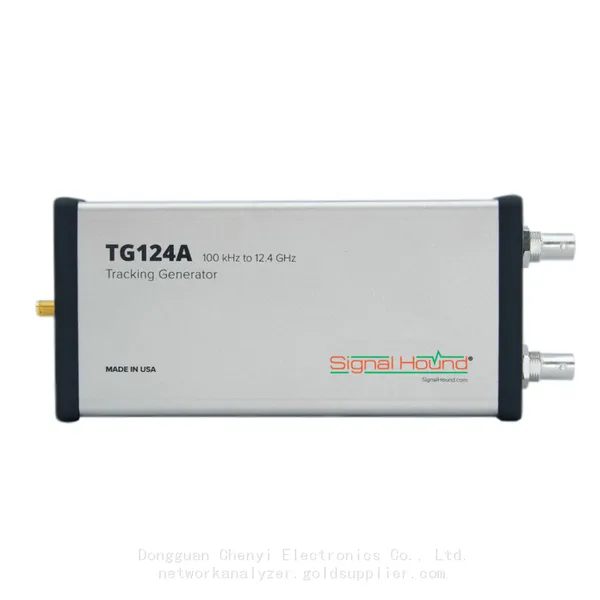
Signal Hound TG124A 100 KHz to 12.4 GHz Tracking GeneratorNegotiableMOQ: 1 Unit
-
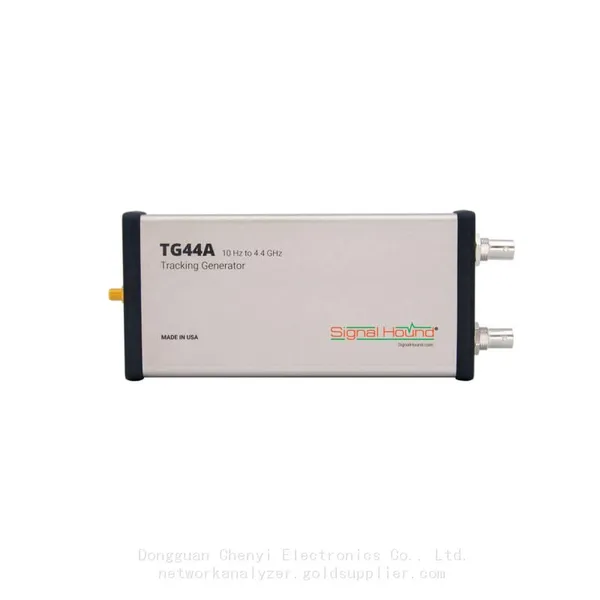
Signal Hound TG44A 10 Hz to 4.4 GHz t Tracking GeneratorNegotiableMOQ: 1 Unit
-
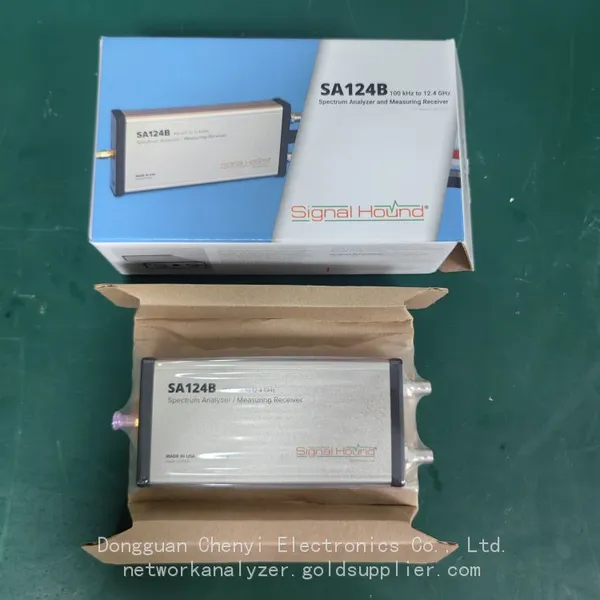
Signal Hound SA124B 100 KHz to 12.4 GHz Spectrum AnalyzerNegotiableMOQ: 1 Unit
-
Signal Hound SA44B 1 Hz to 4.4 GHz Spectrum AnalyzerNegotiableMOQ: 1 Unit
-
Signal Hound SM200B 100 KHz to 20 GHz Real-time Spectrum Analyzer Monitoring ReceiversNegotiableMOQ: 1 Unit
-
Signal Hound SM435C 100 KHz to 43.5GHz Real-time Spectrum Analyzer With 10GbE Monitoring ReceiversNegotiableMOQ: 1 Unit
-
Signal Hound SM435B 100 KHz to 43.5GHz Real-time Spectrum Analyzer Monitoring ReceiversNegotiableMOQ: 1 Unit
-
Signal Hound PN400 Phase Noise and VCO Test System 100 KHz to 43.5 GHzNegotiableMOQ: 1 Unit
-
Keysight E4980A Precision LCR Meter 20 Hz to 2 MHzNegotiableMOQ: 1 Unit
-
Keysight E4980B and E4980BL Precision LCR Meter 20 Hz to 2 MHzNegotiableMOQ: 1 Unit
-
Keysight U1733C Handheld LCR Meter 100Hz 120Hz 1kHz 10kHz 100kHzNegotiableMOQ: 1 Unit