
How to Use the Signal Hound BB60C Spectrum Analyzer
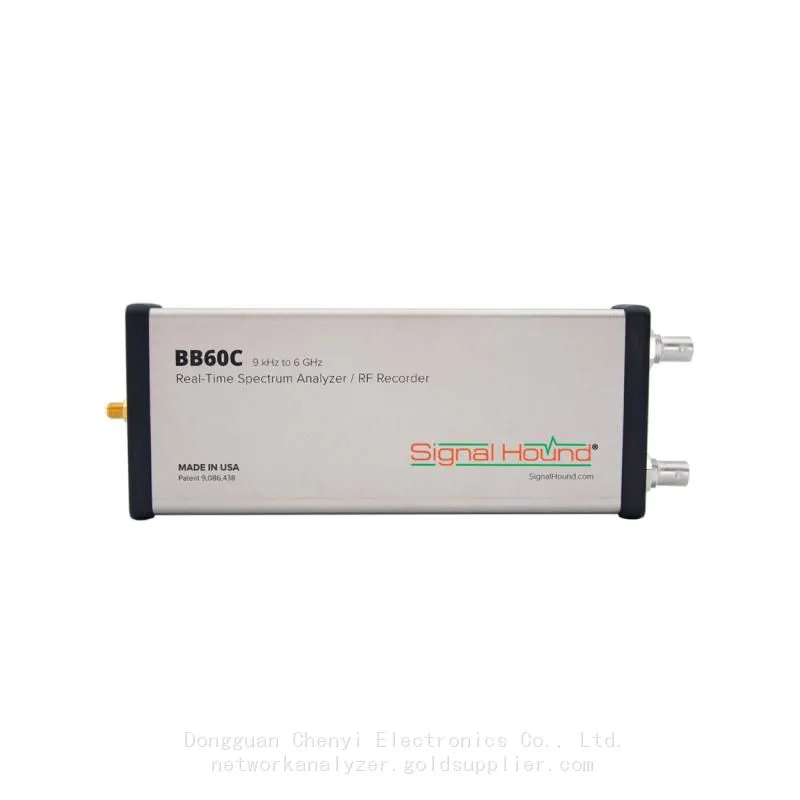
The Signal Hound BB60C is a compact, USB‑powered real‑time spectrum analyzer covering 9 kHz to 6 GHz with 27 MHz instantaneous bandwidthSignal Hound. It connects to a PC via USB 3.0 and is controlled by the free Spike software. This guide covers setup, core operation modes, and common measurements for RF testing, R&D, and field applications.
1. Unboxing & Initial Setup
1.1 Package Contents
BB60C spectrum analyzer unit
USB 3.0 Y‑cable (for power and data)
Spike software installer (CD or download)
Quick‑start guideSignal Hound
1.2 Safety & Input Limits
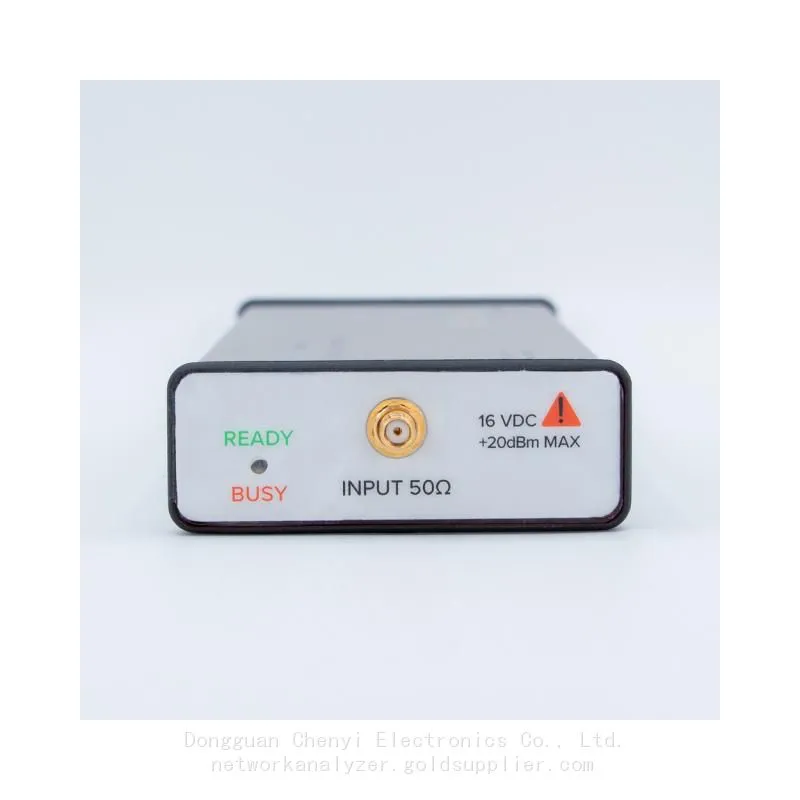
Max RF input: +20 dBm (100 mW); max DC voltage: 16 V
Use ESD protection; avoid over‑driving the input to prevent permanent damage
1.3 System Requirements
OS: Windows 10/11 (64‑bit) or Ubuntu 18.04+ (64‑bit)Signal Hound
CPU: 4th‑gen Intel quad‑core i5/i7 or better (optimized for Intel)Signal Hound
RAM: 8 GB minimum; 16 GB recommended for real‑time analysisSignal Hound
Storage: SSD with ≥250 MB/s write speed for I/Q recordingSignal Hound
1.4 Software Installation
Download the latest Spike software from signalhound.com.
Run the installer with administrator privileges; device drivers are installed automaticallySignal Hound.
Launch Spike; it will prompt you to connect the BB60C.
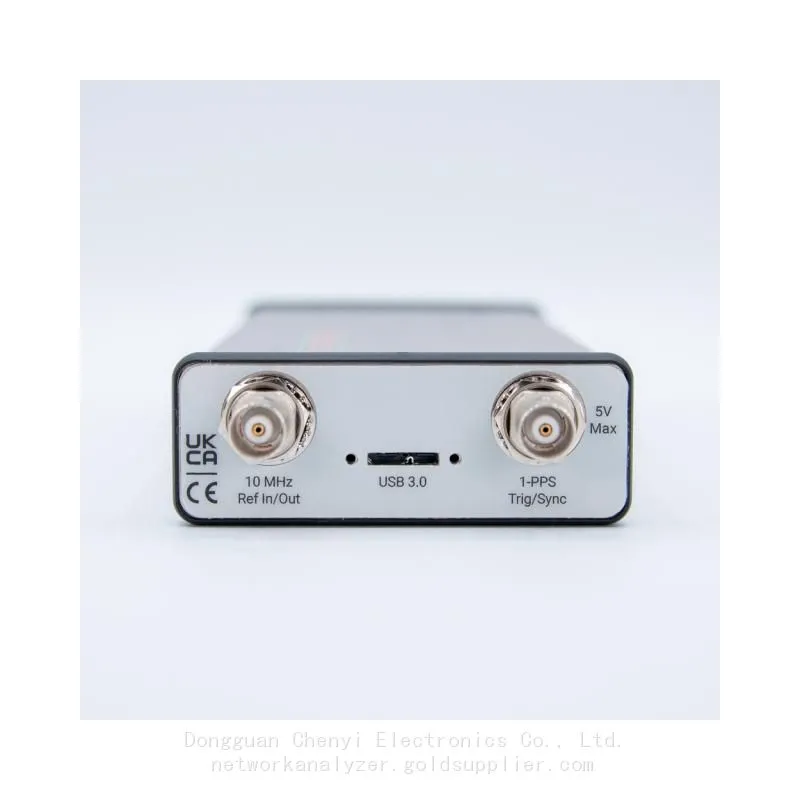
1.5 Hardware Connection
Connect the USB 3.0 end of the Y‑cable to a USB 3.0 port on your PC.
Connect the USB 2.0 end to a second USB port (for auxiliary power).
Attach an antenna or RF cable to the SMA RF input on the BB60C.
The green LED on the BB60C will illuminate when powered and recognized.
In Spike, go to File → Connect Device; the BB60C should appear in the list.
2. Spike Software Interface Overview
Frequency Panel: Set center frequency, span, start/stop frequencies.
Amplitude Panel: Set reference level, attenuation, and scale (dB/div).
BW Panel: Adjust resolution bandwidth (RBW) and video bandwidth (VBW).
Sweep/Real‑Time Panel: Switch between swept and real‑time modes; set sweep time.
Trace & Marker Panel: Control trace display, add markers, and perform peak search.
Measurement Panel: Access channel power, ACPR, OBW, and other built‑in testsSignal Hound.
3. Core Operation Modes
3.1 Swept Spectrum Analysis (Traditional Mode)
Used for wide‑span measurements (beyond 27 MHz) and general spectrum surveyingSignal Hound.
In Spike, select Swept mode.
Set Center Frequency and Span (e.g., 2.4 GHz center, 100 MHz span).
Adjust RBW (e.g., 100 kHz) and VBW (e.g., 10 kHz) for desired resolution and smoothing.
Set Reference Level (e.g., 0 dBm) and Attenuation (auto or manual).
Click Run; the analyzer sweeps across the band and displays the spectrum traceSignal Hound.
Use Markers to read frequency and amplitude at specific points; use Peak Search to find signals.
3.2 Real‑Time Spectrum Analysis (RTSA)
Captures transient or frequency‑hopping signals with 27 MHz instantaneous bandwidthSignal Hound.
Select Real‑Time mode; span is limited to ≤27 MHz.
Set Center Frequency and Span (e.g., 2.45 GHz center, 20 MHz span).
Adjust FFT Size and Update Rate (up to millions of FFTs per second)Signal Hound.
Enable Spectrogram (waterfall) to visualize signal activity over time.
Use Trigger (level, frequency, or pulse) to capture rare events.
3.3 Zero‑Span Analysis
Measures amplitude vs. time at a fixed frequency (like a time‑domain analyzer).
Set Span = 0 (zero‑span).
Enter the target Center Frequency.
Adjust RBW to define the measurement bandwidth.
Set Sweep Time to control the time axis (e.g., 1 ms/div).
Use triggering to capture pulsed or modulated signals.
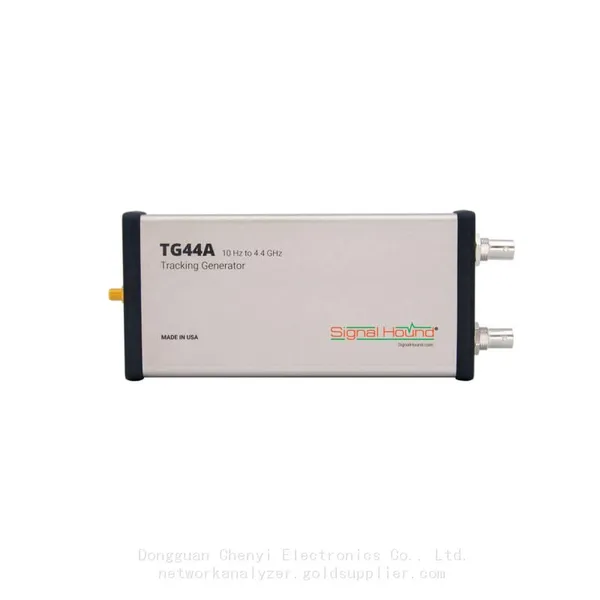
3.4 Scalar Network Analysis (with Tracking Generator)
When paired with a USB‑TG44A/TG124A tracking generator, the BB60C measures insertion loss, return loss, and filter response.
Connect the tracking generator to the BB60C and PC.
In Spike, enable TG mode (firmware v5+ required).
Perform a Thru Calibration (store baseline without DUT).
Insert the DUT (cable, filter, amplifier) and measure transmission vs. frequency.
4. Common RF Measurements
4.1 Channel Power & Occupied Bandwidth (OBW)
Go to the Channel Power panel in Spike.
Set Channel Width (e.g., 200 kHz) and Power Percentage (e.g., 99 % for OBW).
Enable Channel Power and OBW; results are displayed automatically.
4.2 Adjacent Channel Power Ratio (ACPR)
In the Channel Power panel, set Count to 3 or 5 (main + adjacent channels).
Define Channel Spacing (e.g., 200 kHz).
The software calculates power in the main channel and adjacent channels, showing the ratio in dB.
4.3 I/Q Data Recording & Playback
In Spike, go to Record → I/Q Recording.
Select Record Bandwidth (up to 27 MHz) and File Format (e.g., binary).
Click Record; data streams to disk at up to 140 MB/sSignal Hound.
Use Playback to analyze recorded signals offline.
5. Advanced Tips & Best Practices
Calibration: Perform a User Calibration periodically (via Spike) for accurate measurements.
Dynamic Range: Use manual attenuation to avoid compression; start with 0 dB attenuation for weak signals.
CPU Performance: Close background apps; use a high‑performance PC for real‑time analysis to prevent “CPU Resources Exceeded” warningsSignal Hound.
Firmware Updates: Check firmware version in Spike; update via the Signal Hound website for new features.
Residual Signals: Low‑level spurs at 10 MHz multiples may appear in narrow spans (<10 kHz); they are normal.
6. Troubleshooting
Device Not Found: Verify USB connections; restart Spike; reinstall drivers.
No Signal: Check RF cable/antenna; ensure input power is within limits; increase gain/attenuation.
Uncal Warning: Recalibrate the device; check for overload or invalid settingsSignal Hound.
Slow Sweep: Increase RBW; reduce span; use a faster PC.
7. Applications
Wireless communications (Wi‑Fi, Bluetooth, cellular)
RF component test (filters, amplifiers, cables)
EMI/EMC troubleshooting
Signal intelligence and monitoring
IoT and wireless sensor network validation
Recently Posted
-
Cost-Benefit Analysis: Why Choose Signal Hound BB60D for RF Testing Projects
July 2, 2026Cost-Benefit Analysis: Why Choose Signal Hound BB60D for RF Testing ProjectsIn enterprise RF testing projects, laboratory scientif Read More
 -
Ultimate Buying Guide for Signal Hound BB60D Real-Time Spectrum Analyzer: Features, Uses & Benefits
July 2, 2026Ultimate Buying Guide for Signal Hound BB60D Real-Time Spectrum Analyzer: Features, Uses & BenefitsFor RF engineers, laborator Read More
 -
Common Application Scenarios & User Cases of Signal Hound BB60D Spectrum Analyzer
July 2, 2026Common Application Scenarios & User Cases of Signal Hound BB60D Spectrum AnalyzerThe Signal Hound BB60D real-time spectrum ana Read More
 -
Signal Hound BB60D for Radar Signal Analysis & Pulse Signal Testing
July 2, 2026Signal Hound BB60D for Radar Signal Analysis & Pulse Signal TestingRadar signal analysis and pulse signal testing are high-pre
Read More

Contact Us
Recommended Products
-
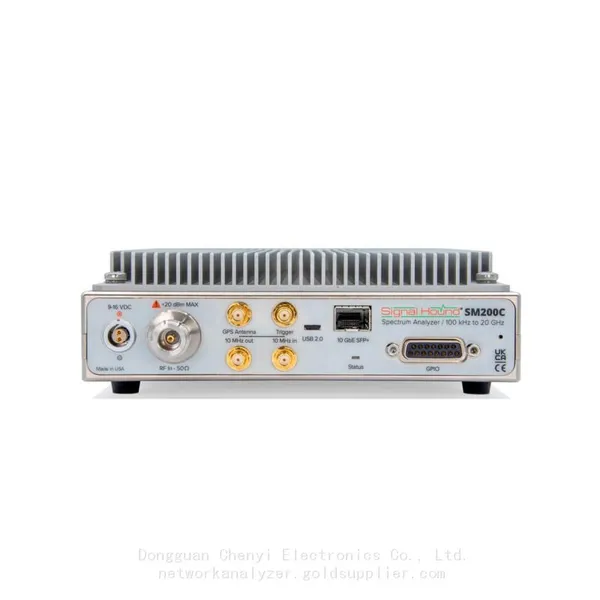
 Signal Hound SM200C 100 KHz to 20 GHz Real-time Spectrum Analyzer With 10GbE Monitoring ReceiversNegotiableMOQ: 1 Unit
 -
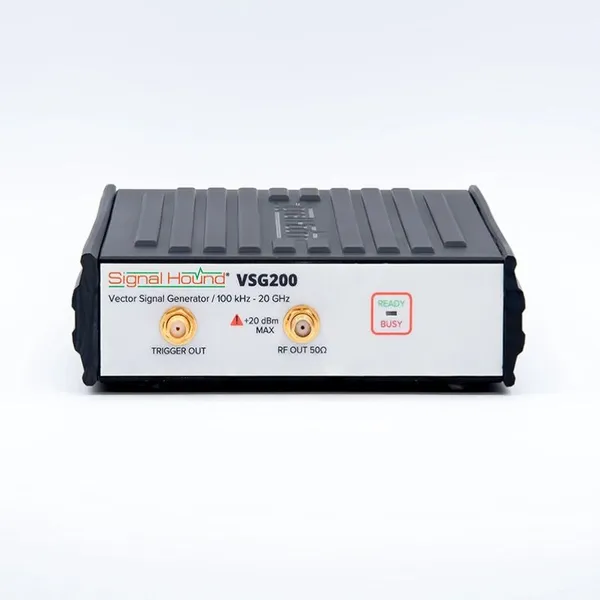
Signal Hound VSG200 Vector Signal Generator 100 KHz to 20 GHzNegotiableMOQ: 1 Unit
-
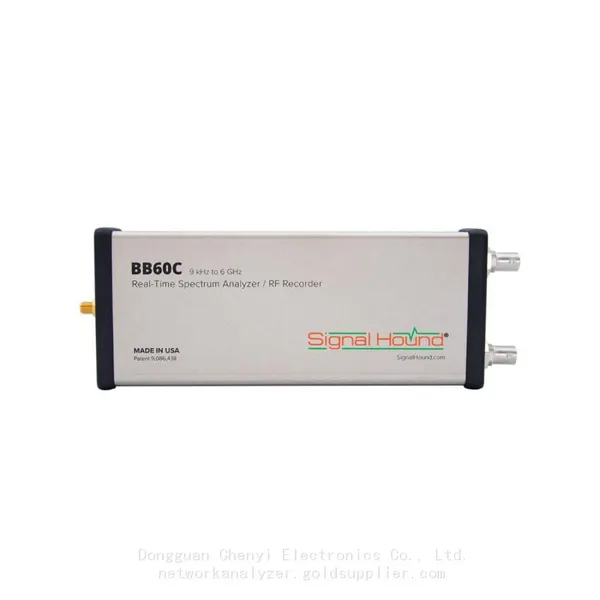
Signal Hound BB60C 9 KHz to 6 GHz Real-time Spectrum AnalyzerNegotiableMOQ: 1 Unit
-
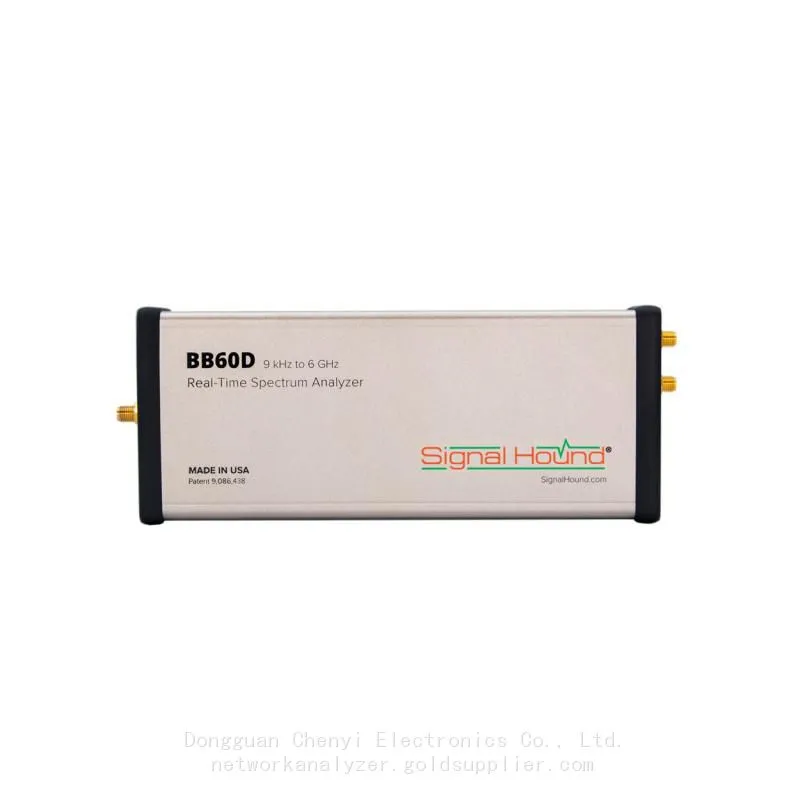
Signal Hound BB60D 9 KHz to 6 GHz Real-time Spectrum AnalyzerNegotiableMOQ: 1 Unit
-
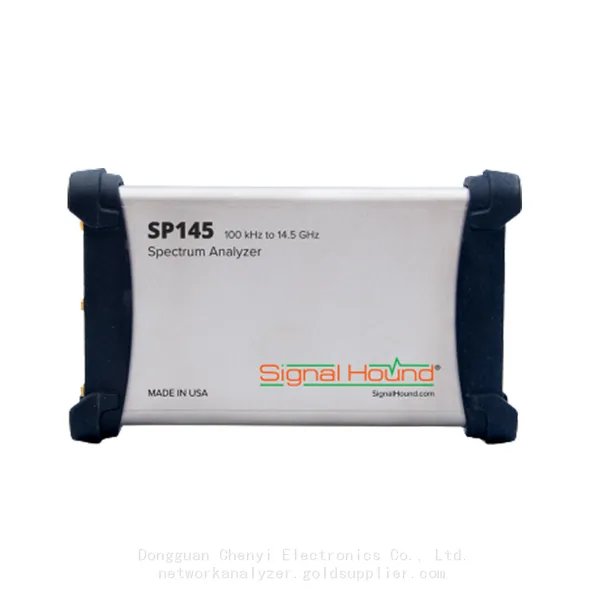
Signal Hound SP145 100 KHz to 14.5 GHz Real-time Spectrum Analyzer Monitoring ReceiversNegotiableMOQ: 1 Unit
-
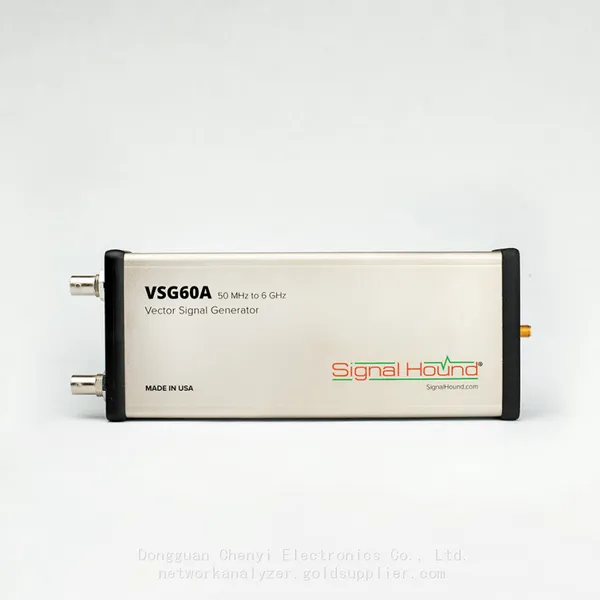
Signal Hound VSG60A 50 MHz to 6 GHz GHz Vector Signal GeneratorNegotiableMOQ: 1 Unit
-
Signal Hound VSG25A 100 MHz to 2.5 GHz Vector Signal GeneratorNegotiableMOQ: 1 Unit
-
Signal Hound VNA400 40 MHz to 40 GHz 2-port Vector Network AnalyzerNegotiableMOQ: 1 Unit
-
Signal Hound PCR4200 100 KHz to 20 GHz Four-Channel Phase Coherent ReceiverNegotiableMOQ: 1 Unit
-
Signal Hound TG124A 100 KHz to 12.4 GHz Tracking GeneratorNegotiableMOQ: 1 Unit
-
Signal Hound TG44A 10 Hz to 4.4 GHz t Tracking GeneratorNegotiableMOQ: 1 Unit
-
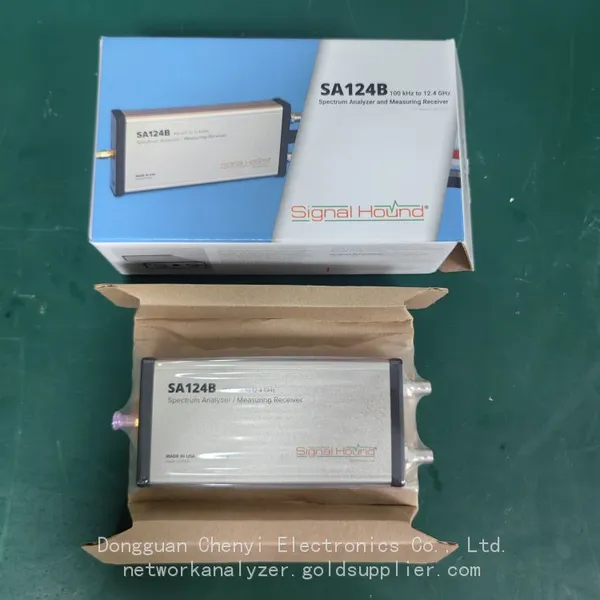
Signal Hound SA124B 100 KHz to 12.4 GHz Spectrum AnalyzerNegotiableMOQ: 1 Unit
-
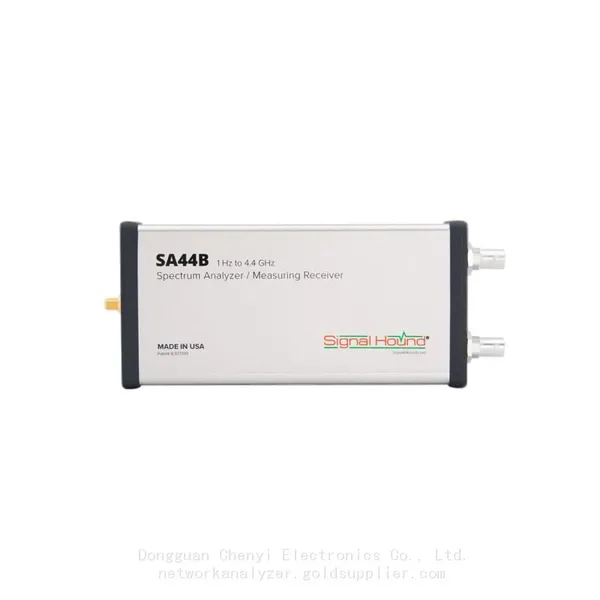
Signal Hound SA44B 1 Hz to 4.4 GHz Spectrum AnalyzerNegotiableMOQ: 1 Unit
-
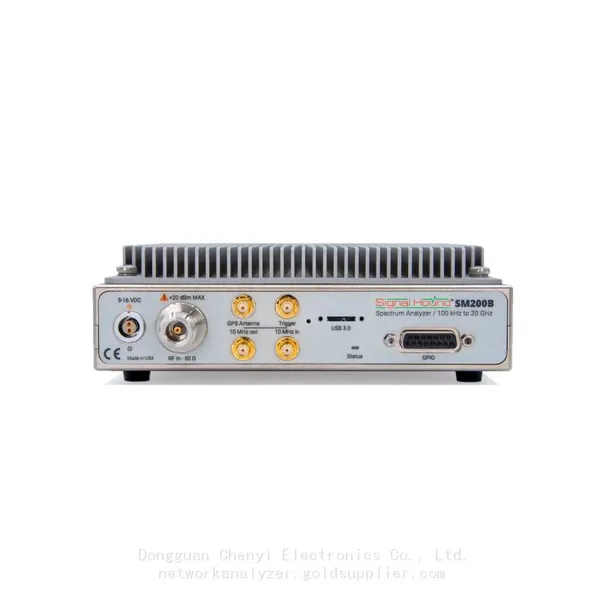
Signal Hound SM200B 100 KHz to 20 GHz Real-time Spectrum Analyzer Monitoring ReceiversNegotiableMOQ: 1 Unit
-
Signal Hound SM435C 100 KHz to 43.5GHz Real-time Spectrum Analyzer With 10GbE Monitoring ReceiversNegotiableMOQ: 1 Unit
-
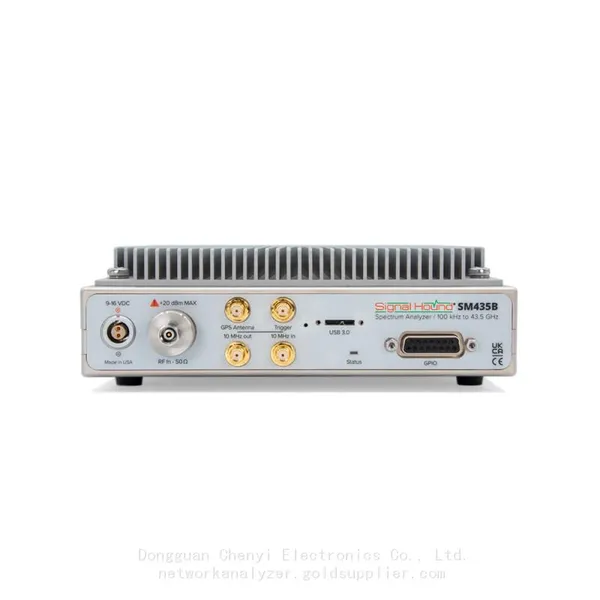
Signal Hound SM435B 100 KHz to 43.5GHz Real-time Spectrum Analyzer Monitoring ReceiversNegotiableMOQ: 1 Unit
-
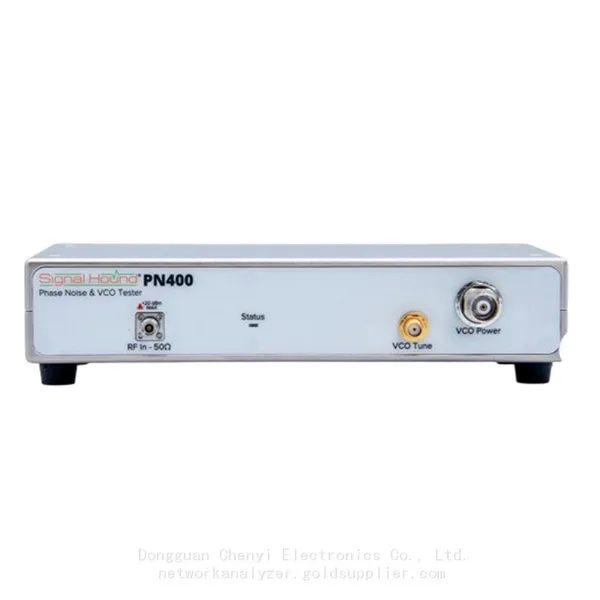
Signal Hound PN400 Phase Noise and VCO Test System 100 KHz to 43.5 GHzNegotiableMOQ: 1 Unit
-
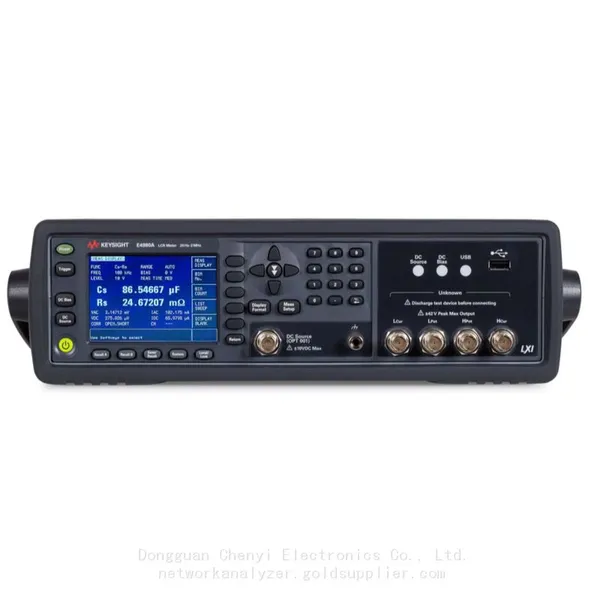
Keysight E4980A Precision LCR Meter 20 Hz to 2 MHzNegotiableMOQ: 1 Unit
-
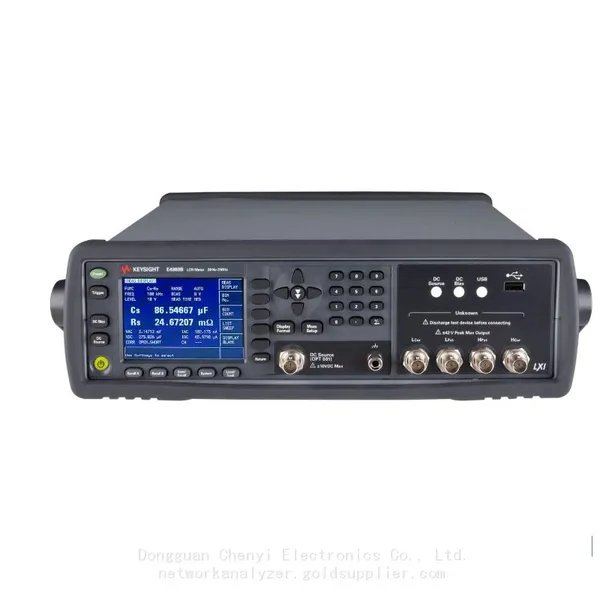
Keysight E4980B and E4980BL Precision LCR Meter 20 Hz to 2 MHzNegotiableMOQ: 1 Unit
-
Keysight U1733C Handheld LCR Meter 100Hz 120Hz 1kHz 10kHz 100kHzNegotiableMOQ: 1 Unit